Categories
general info

The High Mid Market And $1M+ In Provincetown


The luxury market in Provincetown is a great place to be with several gorgeous houses and condos on the market in the high mid-market and the $1M plus market.

Loosely defined the high mid-market is $750K to $1M and it consists of single family homes and higher end condos. There are 9 condos with asking prices in this range – 3 of which are highlighted below and by coincidence are all on Bradford Street Extension in the West End towards the Moors.

There are also 9 single family houses available in this range with an average asking price of $903K.  The three below represent all neighborhoods. The center of town, 15 Standish Way; The West End, 72 Bayberry Avenue; and the East End, 10 Thistlemore Road. (click through to be taken to the property listing information).

21 Bradford St EXT #12, $815K
125 Bradford St EXT #402, $839K
21 Bradford St EXT #14, $995K


15 Standish Way $999K
72 Bayberry Ave $925K
10 Thistlemore $898K


The $1M Plus market. Beautiful properties, big lots and gorgeous homes. As I picked my 6 favorite I realize they represent perfectly the full range, location and style of single family homes in town.

In the far East End 2 Harbour Drive in the Bay Harbour neighborhood surely represents the high end well and at $1.945M isn’t even the most expensive house in the subdivision. #1o Harbour Drive is asking $3.995M. This is a neighborhood of large brand new homes right on the beach.

75 Franklin is a wonderful arts and crafts style home in the near West End Franklin-Pleasant neighborhood.

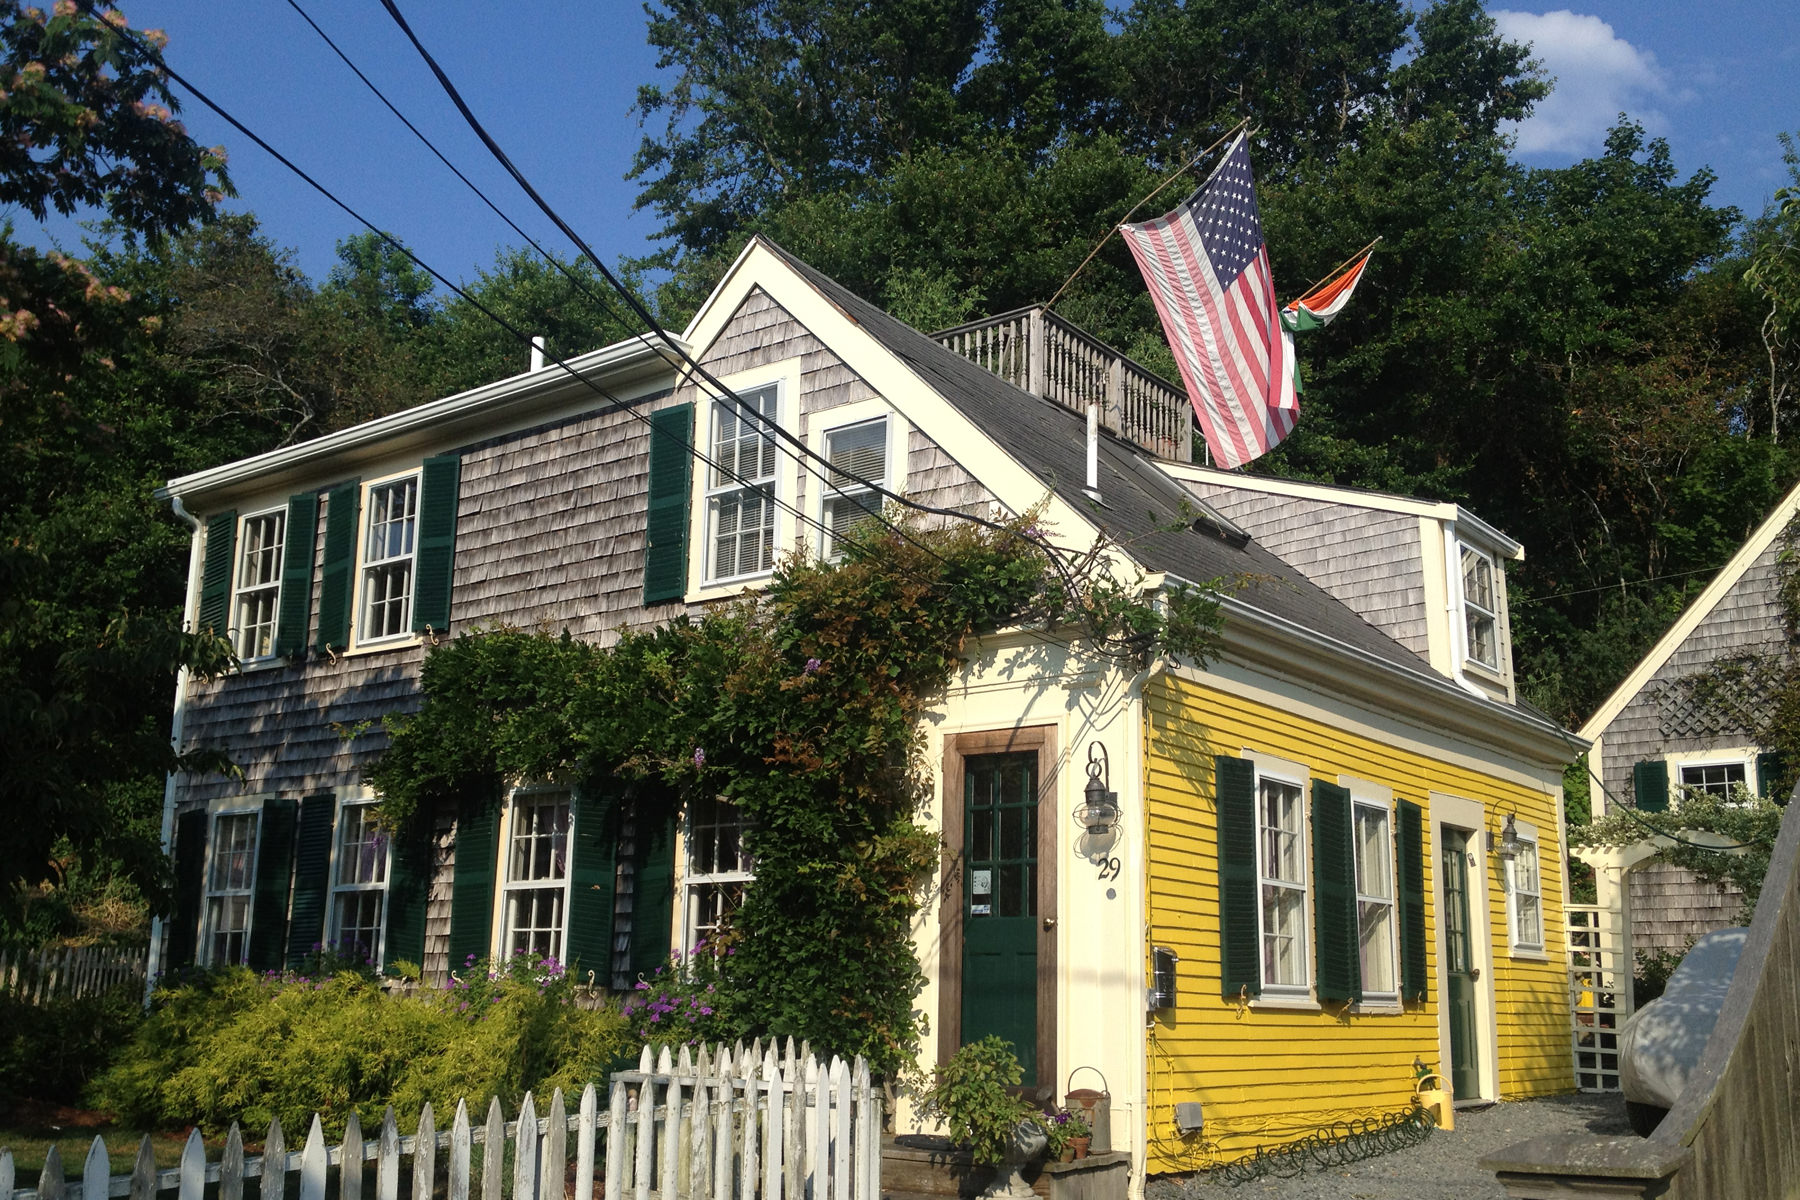
29 Tremont Street is a beautiful antique, wonderfully sited on the corner of Atwood Lane and Tremont Street with a charming separate cottage in the rear.

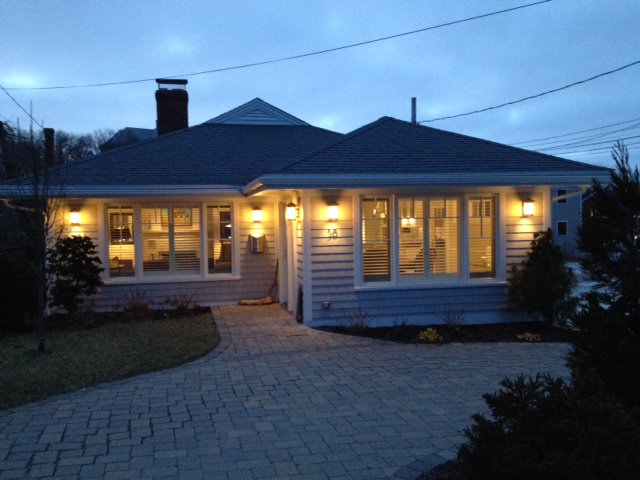
7 Telegraph is one of the gorgeous large houses on The Hill with a fabulous upside down floor plan and drop dead bay views.

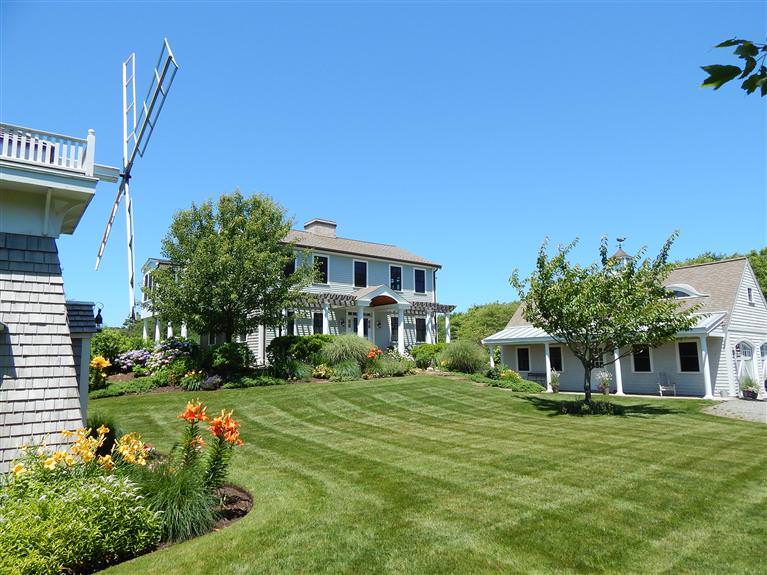
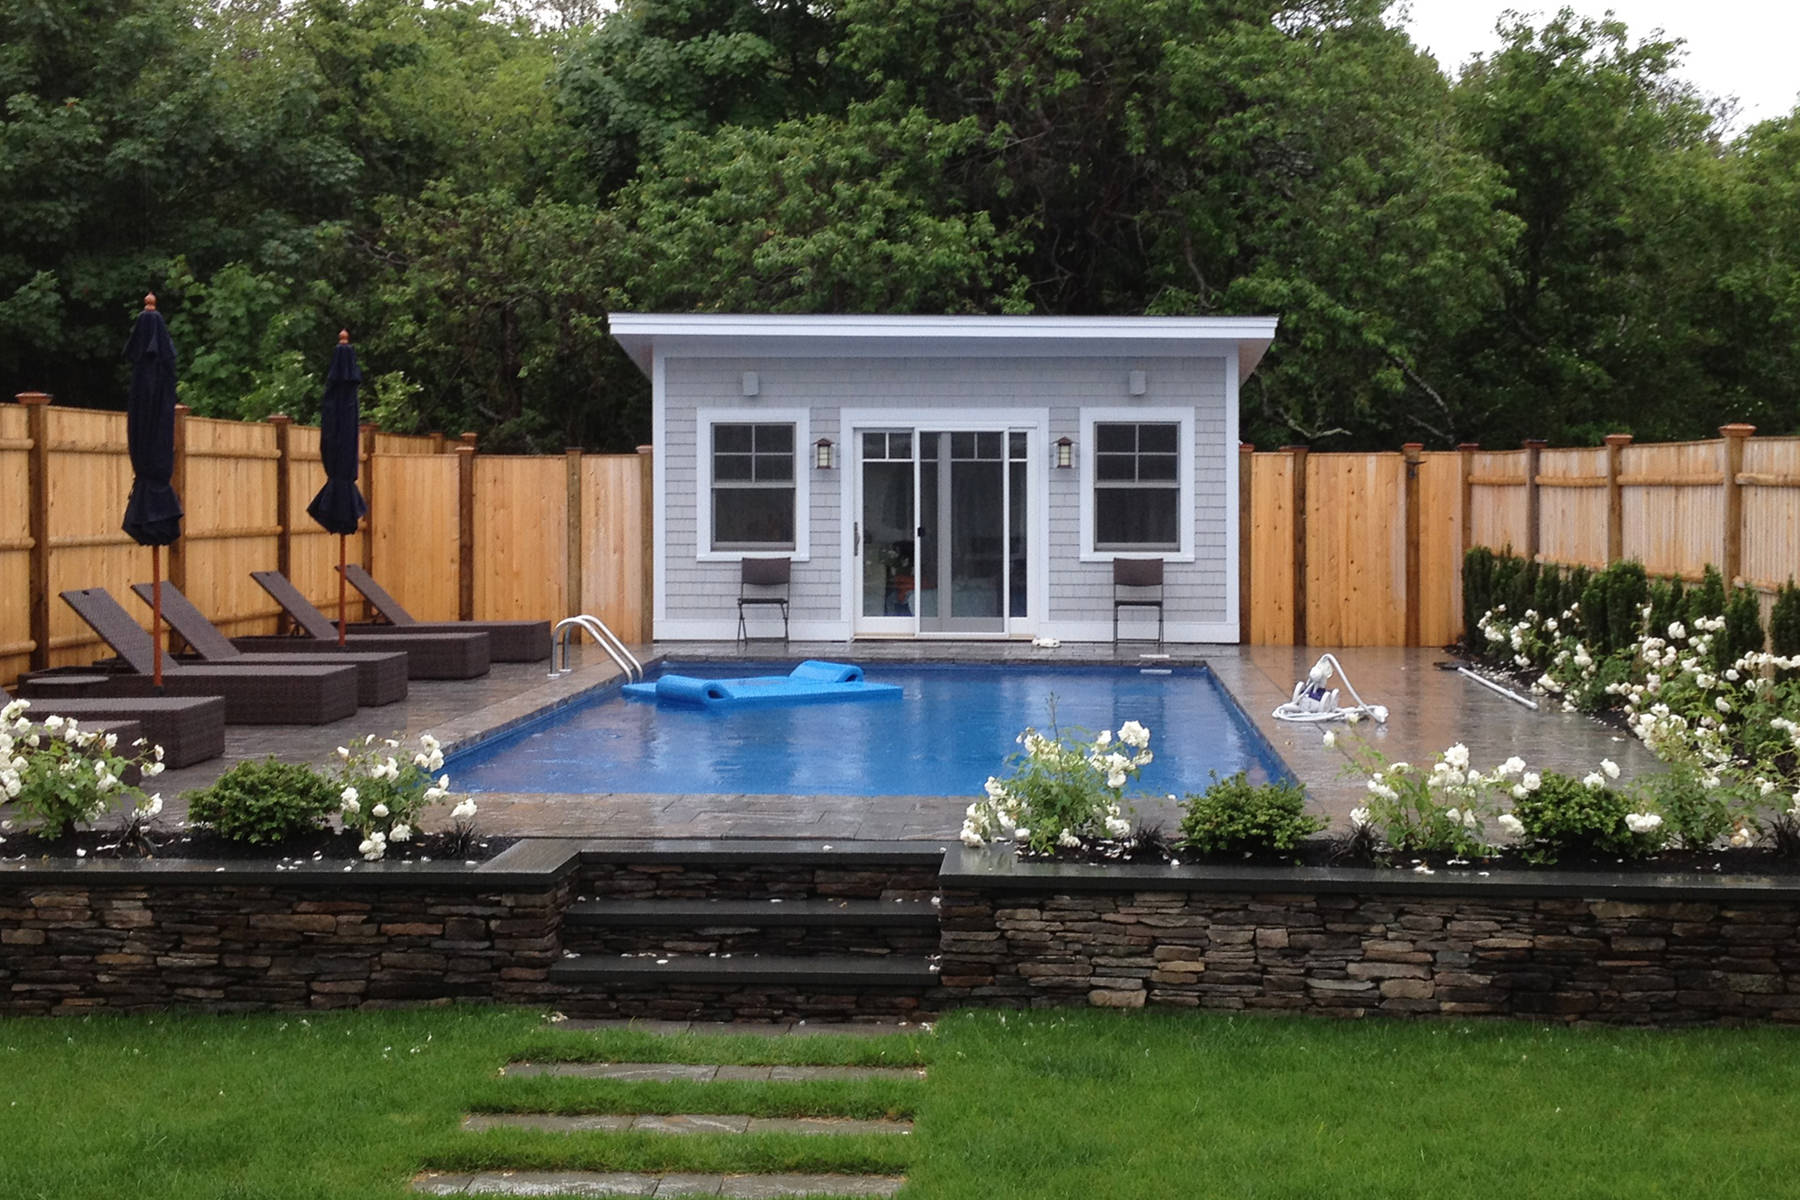
89  Bayberry is one of those great neighborhood houses with a pool, hot tub, and resort like grounds, and an excellent rental or family house.

52 Point Street is a gorgeous large house with a location at the very end of Point Street that is hard to beat.

29 Tremont St $1.095M
29 Tremont Street             $1.095M
75 Franklin St $1.175M
75 Franklin Street        $1.175M
89 Bayberry Avenue $1.195M
89 Bayberry Avenue      $1.195M


2 Harbour Dr $1.945
2 Harbour Drive             $1.945
52 Point St $1.995M
52 Point Street             $1.995M
7 Telegraph Hill $2.896M
7 Telegraph Hill          $2.896M


There are 29 properties available in the $1M plus market in Provincetown, and as you can see from the choices above they represent all styles – traditional large Cape, Arts and Crafts, Antique, modern – there are even 4 large condominiums available in this price range. It has been a surprisingly active market segment so far this year with 15 properties selling for over $1 year to date. The average sale price being $1.541M with an average being 3 bedrooms 3.5 baths and 2,533 square feet. That is an average price per square foot of $608 – for those of you used to real estate shopping in the city where price per square foot, (ppsf) means everything!


Categories
general info

What’s On The Market – Affordable/Entry Level and Mid Market In Provincetown

There are some wonderful properties on the market in Provincetown. I have compiled a late summer review that illustrates the broad range of inventory from affordable condominiums to multi-million dollar waterfront homes.

The affordable entry level market is priced from $200K to $400K and is full of great options. 6 of my favorites are pictured below. There are a total of 48 condos for sale in this price range with an average asking price of $325K. This gets you a 564 square foot 1 bedroom/1 bath condo. Buyers are always surprised that they can get water front or water view in this price range and three of the condos pictured below have have just that. There are even 3 single family properties available in this range.


233 Bradford St #5 $245K
233 Bradford Street #5, $245K
495 Commercial St #4, $289K
495 Commercial Street #4, $289K
616 Commercial #9, $299K
616 Commercial Street #9, $299K


6 Mechanic #D, $315K
6 Mechanic Street #D,     $315K
145 Commercial #M2R, $380K
60 Race Pt Rd #2, $395K
60 Race Point Rd #2,     $395K


The mid market is priced from $400K to $750K. There are 14 single family properties available with an average asking price of $626K. There are 42 condos for sale with an average asking price of $549K.

6 of my favorites are pictured below. 4 of these are stand alone units or end units. A couple of my favorites are 30 Alden Street which is a stand alone 3 story condo with a garage and multiple decks, and 4 Race Road which is a brand new 2 bed/2 bath with fabulous finishes in a terrific neighborhood.

There are 14 single family properties for sale in the mid market range a well.


442 Commercial #2, $424K
442 Commercial Street #2, $424K
68 Race Pt Rd #2, $499K
68 Race Point Road #2, $499K
30 Alden St #5, $545K
30 Alden Street   #5,       $545K


51R Harry Kemp Wy #1, $624K
64 Franklin St #F $654K
64 Franklin Street  #F    $654K
4 Race Road #3 $659K
4 Race Road #3
$659K


There you have it.  The affordable and mid market in Provincetown.  Enjoy!

Categories
general info

Boston Inventory Levels

As an interested observer of the downtown Boston real estate market I am amazed at the contrast with our Cape market. The urgency and temperment of the Boston market is so different than ours as it is being driven so clearly by inventory levels.

Condo inventory is down in Boston (all neighborhoods combined) by 32% over last year at this time to 954 condos available for sale. Days on market are down 32% too to 69 days on market.

24 Worcester Sq #2, 2B/2B, 823 sf, $575K


I remember the days of 300+ listings in the South End and Sundays where there were literally 250+ open houses…in the South End alone. Boy are those days over. There are currently 40 condo listings in the South End as of August 15. Sales remain strong and with the average days on market of 44 properties are going on the market and off the market very quickly.


492 Beacon St #T, 2B/2B, 1,353 sf, $899K


In the Back Bay inventory is down 24% to 91 and days on market are down 43% to 75. There are 91 condos on the market down from 120 last year at this time. It’s interesting that  the market value of these fewer condos is $182M, greater than last years total valuation. Average asking prices are higher.


47 Mt Vernon St #47, 2B/3B,  2,350 sf, $1.299M
47 Mt Vernon St #47, 2B/3B, 2,350 sf, $1.299M


Beacon Hill numbers are astonishing. Inventory is down 29% to 25 condos available on The Hill. Interestingly average days on market are still 131 about the same as last year.


48 Monument Sq #B, 1B/1B,  511 sf, $419K
48 Monument Sq #B, 1B/1B, 511 sf, $419K


In Charlestown condo inventory for sale is down 50% from last year to 50 condos for sale. Average days on market are down 51% to 45.


Q2 sales numbers were down in most Boston neighborhoods…from -1% in South Boston to -39% on Beacon Hill. It will be interesting to see which neighborhoods have the most resilience when it comes to falling sales numbers when we get out first peak at third quarter reporting at the end of September.

Categories
general info

Where Condos Are Going Over Asking Most

Below is an interesting post from David Bates at CurbedBoston. With all the “over asking” activity it’s a fascinating analysis.

Where and Why Hub Condos Go for Over or Under Asking

5%25%2B%20Neogtiating%20Room.jpg

Another month of Boston condominium closings and another couple of hundred above-ask offers accepted.

In nine key condo markets in July, 55.9 percent of sales prices were greater than list prices, which narrowly improves on June’s wicked impressive 55.4 percent share of over-ask offers.

As far as individual condos that sold for the most over-ask, 71-73 Stearns Road, #2, in Brookline sold for $121,00 over-ask; 85 Fayerweather Street in Cambridge sold for $131,000 over-ask; and 79 Chandler Street, #2, in the South End went for $226,000 over-ask.

As well, out of about 1,100 total closings in June and July in these nine key markets, about 90 offers went at least 10 percent over-ask, a segment I think of as “extreme over-asks.” On the other side of the real estate coin, only 62 June/July sales had even 5 percent negotiating room. Those sales with at least 5 percent negotiating room are a segment I think of as “under-asks.”

As I looked at the details of the extreme over-asks and under-asks, I wondered what separated them? Was there any characteristic that could determine whether an on-market condo would attract extreme or negotiated offers? I decided to look into it.

My first thought was to compare location, location, location. What I found out was that extreme over-asks were most prolific in Somerville, where almost one out of every five sales was extreme, and Cambridge, where nearly one out of every seven closings was extreme. In fact, I saw that just four markets (Cambridge, Somerville, Brookline and JP) made up more than 80 percent of all the extreme sales that had occurred in these two months.

Did that mean that under-ask offers permeated in the markets that weren’t dominated by extremes? In one case, this was very true. The No. 1 location for under-asks was Back Bay, a market that not only accounted for more than one-third of all under-asks, but also a market where extreme over-asks were rare.

In other neighborhoods, location didn’t seem to be much of an indicator of whether a condo was going to attract extreme or negotiated offers. For example, Brookline was among the most prolific for extreme over-asks (16), while at the same time it had the second most under-ask offers (10).

If it wasn’t location, then what was the best indicator of whether a condo was most likely to garner under-ask or extreme over-ask offers? The best indicator I found was market time. The shorter the time a condominium was on market, the more likely it was going to get extreme over-ask offers; and the longer the time was on market, the more likely that it was going to receive a negotiated offer.

While the vast majority of extremes sold in seven days or less (63 percent), nearly seven out of every eight (87 percent) under-asks were on market for at least 12 days. And, while only 5 percent of the extremes made it 30 days on market, 50 percent of the under-asks lasted at least 36 days on the market.

So, if negotiating room is the most important room in your condo purchase, don’t look at the neighborhood, look at days on market.


Categories
general info

Condo Prices Increasing Faster Than Single-Family Homes

The post below is from  Dan Stone and his blog The Mortgage Report Daily. He is based in Madison Wisconsin. It also provides a good top level review of mortgages for condos. In our local markets its all about condos so it is interesting to see his mid western viewpoint..i.e. “Getting a mortgage for a condo can sometimes be a challenge”. Regardless it is a good and informative post. Sometimes we need to see what the middle of the country is thinking and doing.

 Case-Shiller Index : U.S. Condos Increasing In Value Faster Than Comparable Single-Family Homes

August 9,  2013.

Case-Shiller Index shows home prices in U.S. condominiums and co-ops outpacing single-family residences

As the U.S. housing market gains, it’s taking the condominium market with it.

Home price growth in condos and co-ops is outpacing growth in single-family residences. This is a major shift for the housing market — condos were among the most distressed sectors of last decade’s housing market downturn.

Home sellers are getting higher prices for their condos.

Los Angeles Condos Jump 23%; Chicago Rises 12%

According to the most recent Case-Shiller Index, home values climbed 12.2 percent nationwide for the 12 months ending May 2013. This jump marks the biggest one-year increase in home valuation since the Case-Shiller Index launched 26 years ago.

Each of the Case-Shiller Index’s 20 tracked cities posted annual gains, led by the San Francisco Bay Area; Las Vegas, Nevada; and Phoenix, Arizona. Home valuations in the Las Vegas are up 23% since from 12 months ago, which claws back against the heavy losses sustained last decade.

The “last place” finisher in the May 2013 Case-Shiller Index? New York City.

As compared to one year ago, home values in the city’s five boroughs — Manhattan, Brooklyn, Queens, the Bronx, and Staten Island — rose just 3.3 percent, which is well below the U.S. national average.

However, the Case-Shiller headline figure tells just part of the story.

In New York City, the market is thick with condominiums and co-ops and it just so happens that the Case-Shiller Index ignores homes of these types. If we were to add back condos and co-ops to the Case-Shiller Index data, we’d actually see that New York City is performing quite well.

In New York, condo values are up nearly 10% since last year — well above the broader index’s reading of 3.3 percent.

The same is true in other Case-Shiller Index markets, too. Condos in the 4 other cities tracked by the Case-Shiller Condominium Index showed strong annual gains, and each outpaced its home city.

  • Los Angeles, California : Condos +23.1% annually (versus +19.2% for single-family homes)
  • San Francisco, California : Condos + 27.6% annually (versus +24.5% for single-family homes)
  • Chicago, Illinois : Condos + 11.9% annually (versus +8.5% for single-family homes)
  • Boston, Massachusetts : Condos +8.7% annually (versus +7.5% for single-family homes)
  • New York City, New York : Condos + 9.8% annually (versus +3.3% for single-family homes)

With tight supply and limited construction, buyers of condos and co-ops should expect higher home prices through the end of 2013 and into early-2014, at least.

Mortgages For Condominiums

Getting a mortgage for a condo can sometimes be a challenge. Last decade, lenders were burned on condos for a variety of reasons and so they’ve bounced back on condo loans a bit more cautious and a bit more wise.

Today’s buyers of condos have fewer financing choices as compared to buyers of single-family detached homes.

As one example, buyers using conventional mortgage financing via Fannie Mae or Freddie Mac pay a premium for all loans with less than 25% equity. For this reason, buyers of condos and co-ops are encouraged to cap loans at 75% loan-to-value (LTV).

Condo loans above 75% LTV remain acceptable and approvable, however, the accompanying mortgage rate and/or closing costs will likely be higher.

VA loans for condos are available, too. VA loans allow 100% financing with no mortgage insurance required. Mortgage rates tend to be relatively low with a VA loan because all VA loans are guaranteed by the government.

In nearly all cases, though, buyers of condominiums will want to verify a building’s warrantability.

“Warrantability” is a mortgage term whether mortgages in a given condo building are eligible for purchase by Fannie Mae or Freddie Mac. Non-warrantable condos are sometimes denied for funding, but not always.

A building’s warrantability is based on a host of traits, some of which include :

  1. No person owns more than 10% of the building units
  2. No more than 50% of the building’s units are active rental units
  3. No more than 20% of the building is dedicated to commercial/retail space

To determine whether a building is warrantable or non-warrantable, mortgage lenders will often use a “condominium questionnaire”, which addresses the lendability of a building.

Non-warrantable condos can still be financed, it should be mentioned. Product availability, however, is limited and mortgage rates are sometimes higher.

The Case-Shiller Index reports rising values for today’s condos and co-ops. In many cases, condo prices have climbed more than for comparable single-family residences. Buyers of condos should expect rising prices.

About the Author

Dan Green (NMLS #227607) is an active loan officer with Waterstone Mortgage. You can also connect with Dan on Twitter and on Google+.

Categories
general info

Provincetown Mid Summer Update

August 5, 2013

What a beautiful few days we have had in Provincetown. Bright sun, finally drier and with perfect temperatures. The “in between week” last week was a fun week with no formal theme. Family week has just begun and Carnival is right around the corner. I thought it would be a great time to do a mid summer market update.

The closings and activity of the spring market have slowed, and the anticipation for the big fall market is beginning. Buyers and sellers are in true summer vacation mode but prepping for the market ahead…although the past week was a very busy week as 10 properties went under contract! 4 single family and 6 condos.

 Condos

Year to date as of August 5, 61 condos have sold with an average sales price of $424K. The average property sold was a 2 bedroom 1.5 bathroom condo of 875 square feet. Below are 3 condos that represent a good cross section of these year to date sales. 147 Commercial Street #L-3 is in the very popular Fisherman’s Wharf  complex, a waterfront address with a fabulous beachfront deck right on the bay.  21 Court Street #4 is an impeccable 2 bedroom unit tucked away between Court Street and Watson’s Court. 21 Bradford Street Extension #2 is an incredible  3 bedroom 3.5 bath water view condo in the Herring Cove Village complex in the far West End.

147 Commercial S t#C $260K
147 Commercial S t#L3   $275K
21 Court St #4 $435K
21 Court St #4                  $435K
21 Bradford St EXT #2 $880K
21 Bradford St EXT #2   $880K


Last year 82 condos were sold with an average sales price of $403K. The average was a 2 bedroom, 1.5 bath condo with 850 square feet. As you can see we have a little catching up to do in the number of sales this year vs last year, but the average price of a condo sold has increased 5% this year. As I have mentioned in earlier posts a slow first quarter put us a little behind last years condo numbers but a solid few months has put us back on track.

There are 110 condos available for sale with an average asking price of $472K, the average being a 2/1.5, and 910 square feet. The three shown below illustrate the diversity in price, style, and location of our condo inventory. 233 Bradford Street #5 is a darling 1 bedroom duplex “floor through” with a switchback staircase to a renovated bedroom/bath level. There is a charming path to Commercial Street and the bay beach from the common deck-gaarden area in the back of the complex. 15 Cottage Street #9 is a rare pool front condo with 3 bedrooms 2 baths and 1,710 square feet in a well maintained West End complex. 493 Commercial Street #13 is an incredible 2 bedroom 2 bath condo on the water in the East End.

233 Bradford St #5 $245K
233 Bradford Street #5  $245K
15 Cottage St #9 $594K
15 Cottage Street #9       $594K
493 Commercial St $1.1M
493 Commercial Street     $1.1M


 Single Family homes.

27 single family homes have sold with an average sale price of $1.078M, the average is a 3 bedroom 2.5 bath home of 2,102 square feet. This is just one less than sold last year. This average sold price represents a 50% increase from last year. The averages are skewed somewhat as there have been several sales over $1M this year, but this increase does illustrate the strength of our single family market. The three properties highlighted below are great examples of single family houses sold. 61 Harry Kemp Way is one of our favorites. The attention to detail in this house is incredible and includes details like ceiling fans on the front farmers porch, smart wiring everywhere and gorgeous landscaping. 67 Bradford Street Ext is a 3 bedroom 2 bath home on a 10,000 square foot lot just below Pilgrim Heights Road and a block from the moors. An incredible piece of property which the new owners are renovating into a showplace.  13 Pilgrim Heights Road is a substantial house  of 4, 559 square feet with 5 bedrooms and 5 baths and a pool. A wonderful property on close to a half acre lot.

61 Harry Kemp Way $781K
61 Harry Kemp Way       $781K
67 Bradford St Ext  $848K
67 Bradford Street  Ext $848K
13 Pilgrim Heights Rd $1.235M


Last year 28 single family homes sold with an average sales price of $717, and the average was a 3 bedroom, 2.5 bath of  1,881 square feet. The average sold price this year is 50% higher at $1.078M.


There are 53 single family homes on the market with an average asking price of $1.436M, and with an average of 4 bedrooms 4 baths and 2,610 square feet. Three of our favorites are pictured below. 29 Tremont Street is one of the most charming properties in town. Nestled on the corner of Tremont Street and Atwood Street, the 4 bedroom 3 bath property consists of an antique colonial main house and a perfect  1 bedroom cottage in the rear. 10 R Commercial Street is another great property hidden behind the Delft Haven with a main house and a charming guest house and beautiful grounds. 7 Telegraph Hill is a spectacular hilltop home with 3 bedrooms and 3.5 baths, and is one of the properties I mentioned in a prior post about Telegraph Hill

These homes represent the best of Provincetown on so many levels. Each is a significant quality property that speaks to the interest and excitement that exists for real estate here on our wonderful town.

29 Tremont St $1.095M
29 Tremont Street       $1.095M
10 R Commercial St $1.995M
10 R Commercial Street  $1.995M
7 Telegraph Hill  $2.896M
7 Telegraph Hill
$2.896M


That’s the mid summer update here in Provincetown. Sales are on track to come close to or meet last years records, and if last weeks activity is a predictor we certainly will come close. Call or stop in to say hello when you are in town. Our office is at 139 Commercial Street in the West End.


Categories
general info

Bungalow 58 Poolhouse Sold

One of our favorite properties that we recently marketed closed this past week…the 1,800+ sf 2 bedroom 2.5 bath single  family room home sold for $1.026M. It is a prime example of a quality, thoughtfully designed home, with a multitude of extras… selling fairly quickly and for an excellent price.

58 Franklin St $1.059M


The house garnered lots of excitement when it was listed as it was a complete renovation of a 1958 bungalow style ranch in the Franklin Street neighborhood. As you know there are only a handful of houses in town that have pools and this has to be one of the best.


pool 2pool 1


master bedroom 2kitchen 1


roaring frplc

2012 349

Categories
general info

5 Reasons To Sell Now

I couldn’t have said it better, and I reiterate that I rarely post “Buy Now”, “Sell Now” articles, but this succinctly outlines the reasons why…and with a national perspective.

Selling a House? 5 Reasons You Should Do It Now

by THE KCM CREW

five fingersMany are talking about why now is a great time to buy a home. Today, we want to look at why it might also be an opportune time to sell your house. Here are the Top 5 Reasons we believe now may be a perfect time to put your house on the market.

1.) Demand Is High

Homes are selling at the fastest pace since November 2009 when the market spiked in response to the home buyer tax credit. The most recent Existing Home Sales Report by the National Association of Realtors (NAR) showed that monthly sales increased over the same month last year. Total sales have been above year-ago levels for 22 consecutive months. There are buyers out there right now (buyer traffic is 31 percent stronger than a year ago) and they are serious about purchasing.

2.) Supply Is Beginning to Increase

Total housing inventory is rising. Many expect inventory to continue to rise as more sellers escape the shackles of negative equity. Selling now while demand is high and before supply increases may garner you your best price.

3.) New Construction Is Coming Back

Over the last several years, most homeowners selling their home did not have to compete with a new construction project around the block. As the market is recovering, more and more builders are jumping back in. These ‘shiny’ new homes will again become competition as they are an attractive alternative for many purchasers.

4.) Interest Rates Are Rising

According to Freddie Mac’s Primary Mortgage Market Survey, interest rates for a 30-year mortgage have shot up to 3.98% which represents a jump of more than ½ point since the beginning of the year. Even those trying to be the voice of reason on this issue are projecting higher rates. For example, Polyana da Costa, senior mortgage analyst atBankrate.com said:

“Rates are unlikely to keep going up so quickly and should remain below 5%.”

Whether you are moving up or moving down, your housing expense will be more a year from now if a mortgage is necessary to purchase your next home.

5.) It’s Time to Move On with Your Life

Look at the reason you are thinking about selling and decide whether it is worth waiting. Is the possibility of a few extra dollars more important than being with family; more important than your health; more important than having the freedom to go on with your life the way you think you should?

You already know the answers to the questions we just asked. You have the power to take back control of your situation by putting the house on the market today. The time may have come for you and your family to move on and start living the life you desire. That is what is truly important.