August 5, 2013
What a beautiful few days we have had in Provincetown. Bright sun, finally drier and with perfect temperatures. The “in between week” last week was a fun week with no formal theme. Family week has just begun and Carnival is right around the corner. I thought it would be a great time to do a mid summer market update.
The closings and activity of the spring market have slowed, and the anticipation for the big fall market is beginning. Buyers and sellers are in true summer vacation mode but prepping for the market ahead…although the past week was a very busy week as 10 properties went under contract! 4 single family and 6 condos.
Condos
Year to date as of August 5, 61 condos have sold with an average sales price of $424K. The average property sold was a 2 bedroom 1.5 bathroom condo of 875 square feet. Below are 3 condos that represent a good cross section of these year to date sales. 147 Commercial Street #L-3 is in the very popular Fisherman’s Wharf complex, a waterfront address with a fabulous beachfront deck right on the bay. 21 Court Street #4 is an impeccable 2 bedroom unit tucked away between Court Street and Watson’s Court. 21 Bradford Street Extension #2 is an incredible 3 bedroom 3.5 bath water view condo in the Herring Cove Village complex in the far West End.


Last year 82 condos were sold with an average sales price of $403K. The average was a 2 bedroom, 1.5 bath condo with 850 square feet. As you can see we have a little catching up to do in the number of sales this year vs last year, but the average price of a condo sold has increased 5% this year. As I have mentioned in earlier posts a slow first quarter put us a little behind last years condo numbers but a solid few months has put us back on track.
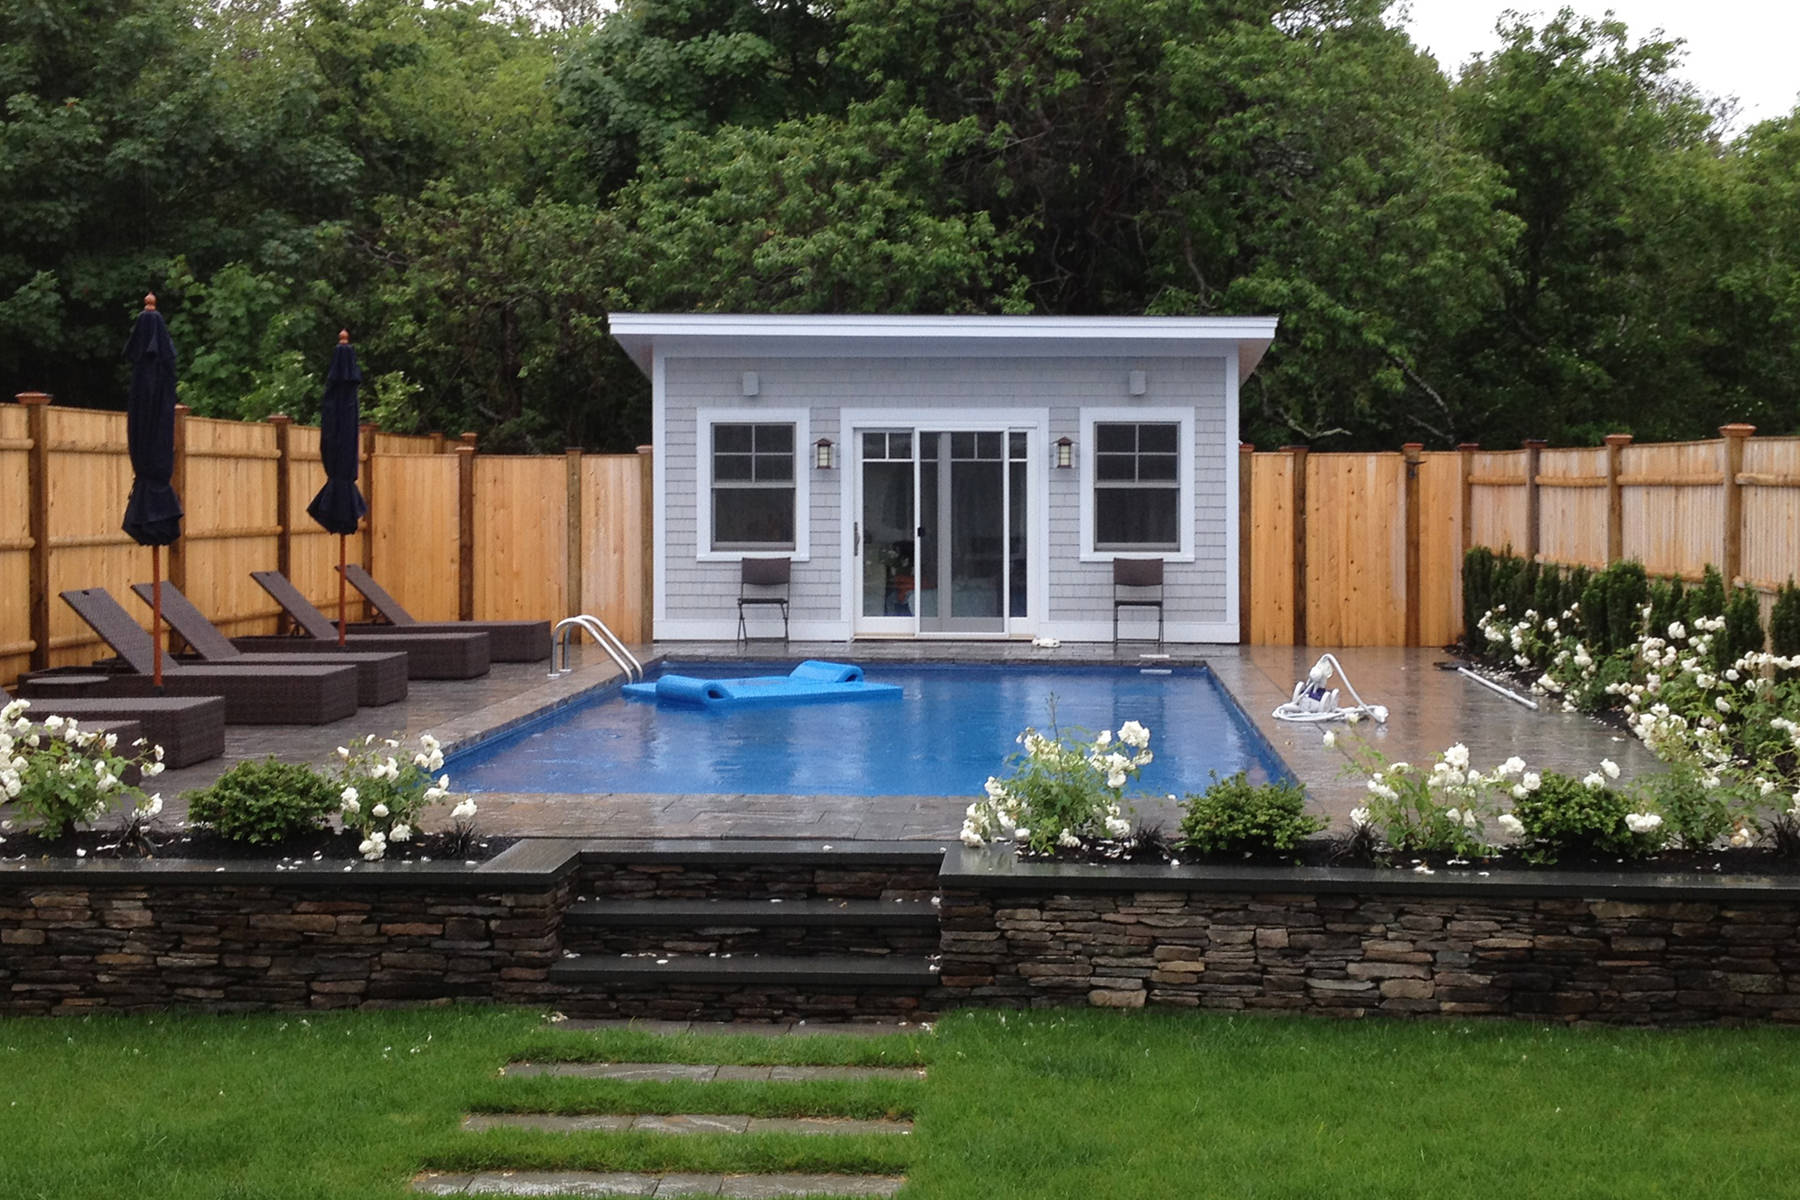
There are 110 condos available for sale with an average asking price of $472K, the average being a 2/1.5, and 910 square feet. The three shown below illustrate the diversity in price, style, and location of our condo inventory. 233 Bradford Street #5 is a darling 1 bedroom duplex “floor through” with a switchback staircase to a renovated bedroom/bath level. There is a charming path to Commercial Street and the bay beach from the common deck-gaarden area in the back of the complex. 15 Cottage Street #9 is a rare pool front condo with 3 bedrooms 2 baths and 1,710 square feet in a well maintained West End complex. 493 Commercial Street #13 is an incredible 2 bedroom 2 bath condo on the water in the East End.

-
15 Cottage Street #9 $594K


Single Family homes.
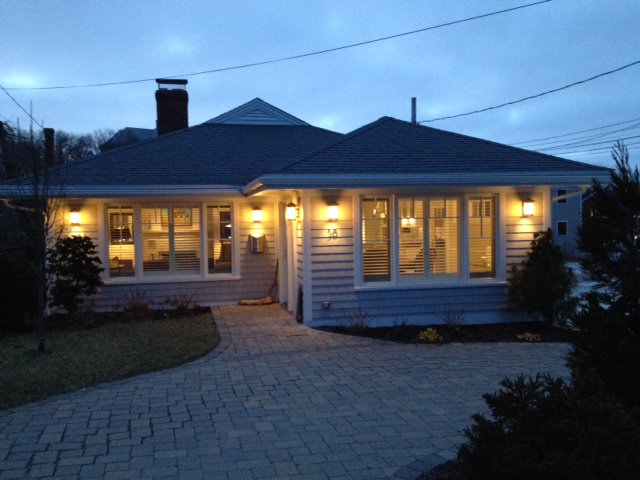
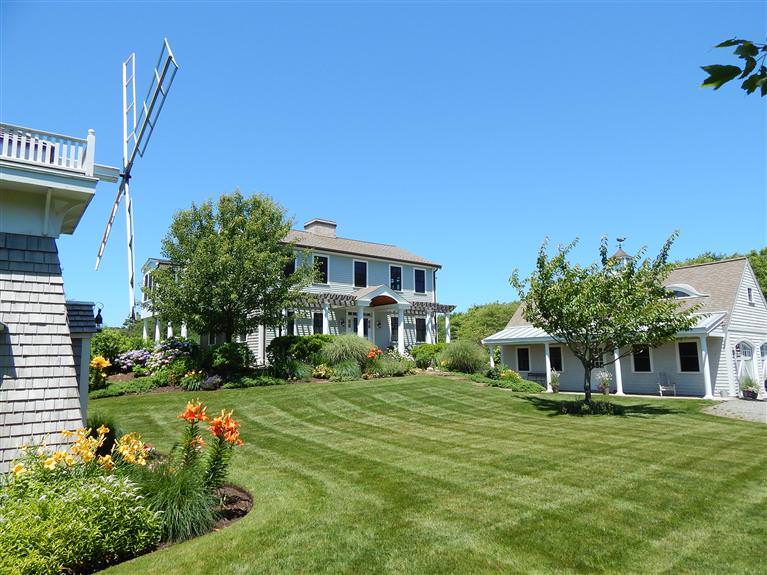
27 single family homes have sold with an average sale price of $1.078M, the average is a 3 bedroom 2.5 bath home of 2,102 square feet. This is just one less than sold last year. This average sold price represents a 50% increase from last year. The averages are skewed somewhat as there have been several sales over $1M this year, but this increase does illustrate the strength of our single family market. The three properties highlighted below are great examples of single family houses sold. 61 Harry Kemp Way is one of our favorites. The attention to detail in this house is incredible and includes details like ceiling fans on the front farmers porch, smart wiring everywhere and gorgeous landscaping. 67 Bradford Street Ext is a 3 bedroom 2 bath home on a 10,000 square foot lot just below Pilgrim Heights Road and a block from the moors. An incredible piece of property which the new owners are renovating into a showplace. 13 Pilgrim Heights Road is a substantial house of 4, 559 square feet with 5 bedrooms and 5 baths and a pool. A wonderful property on close to a half acre lot.


Last year 28 single family homes sold with an average sales price of $717, and the average was a 3 bedroom, 2.5 bath of 1,881 square feet. The average sold price this year is 50% higher at $1.078M.
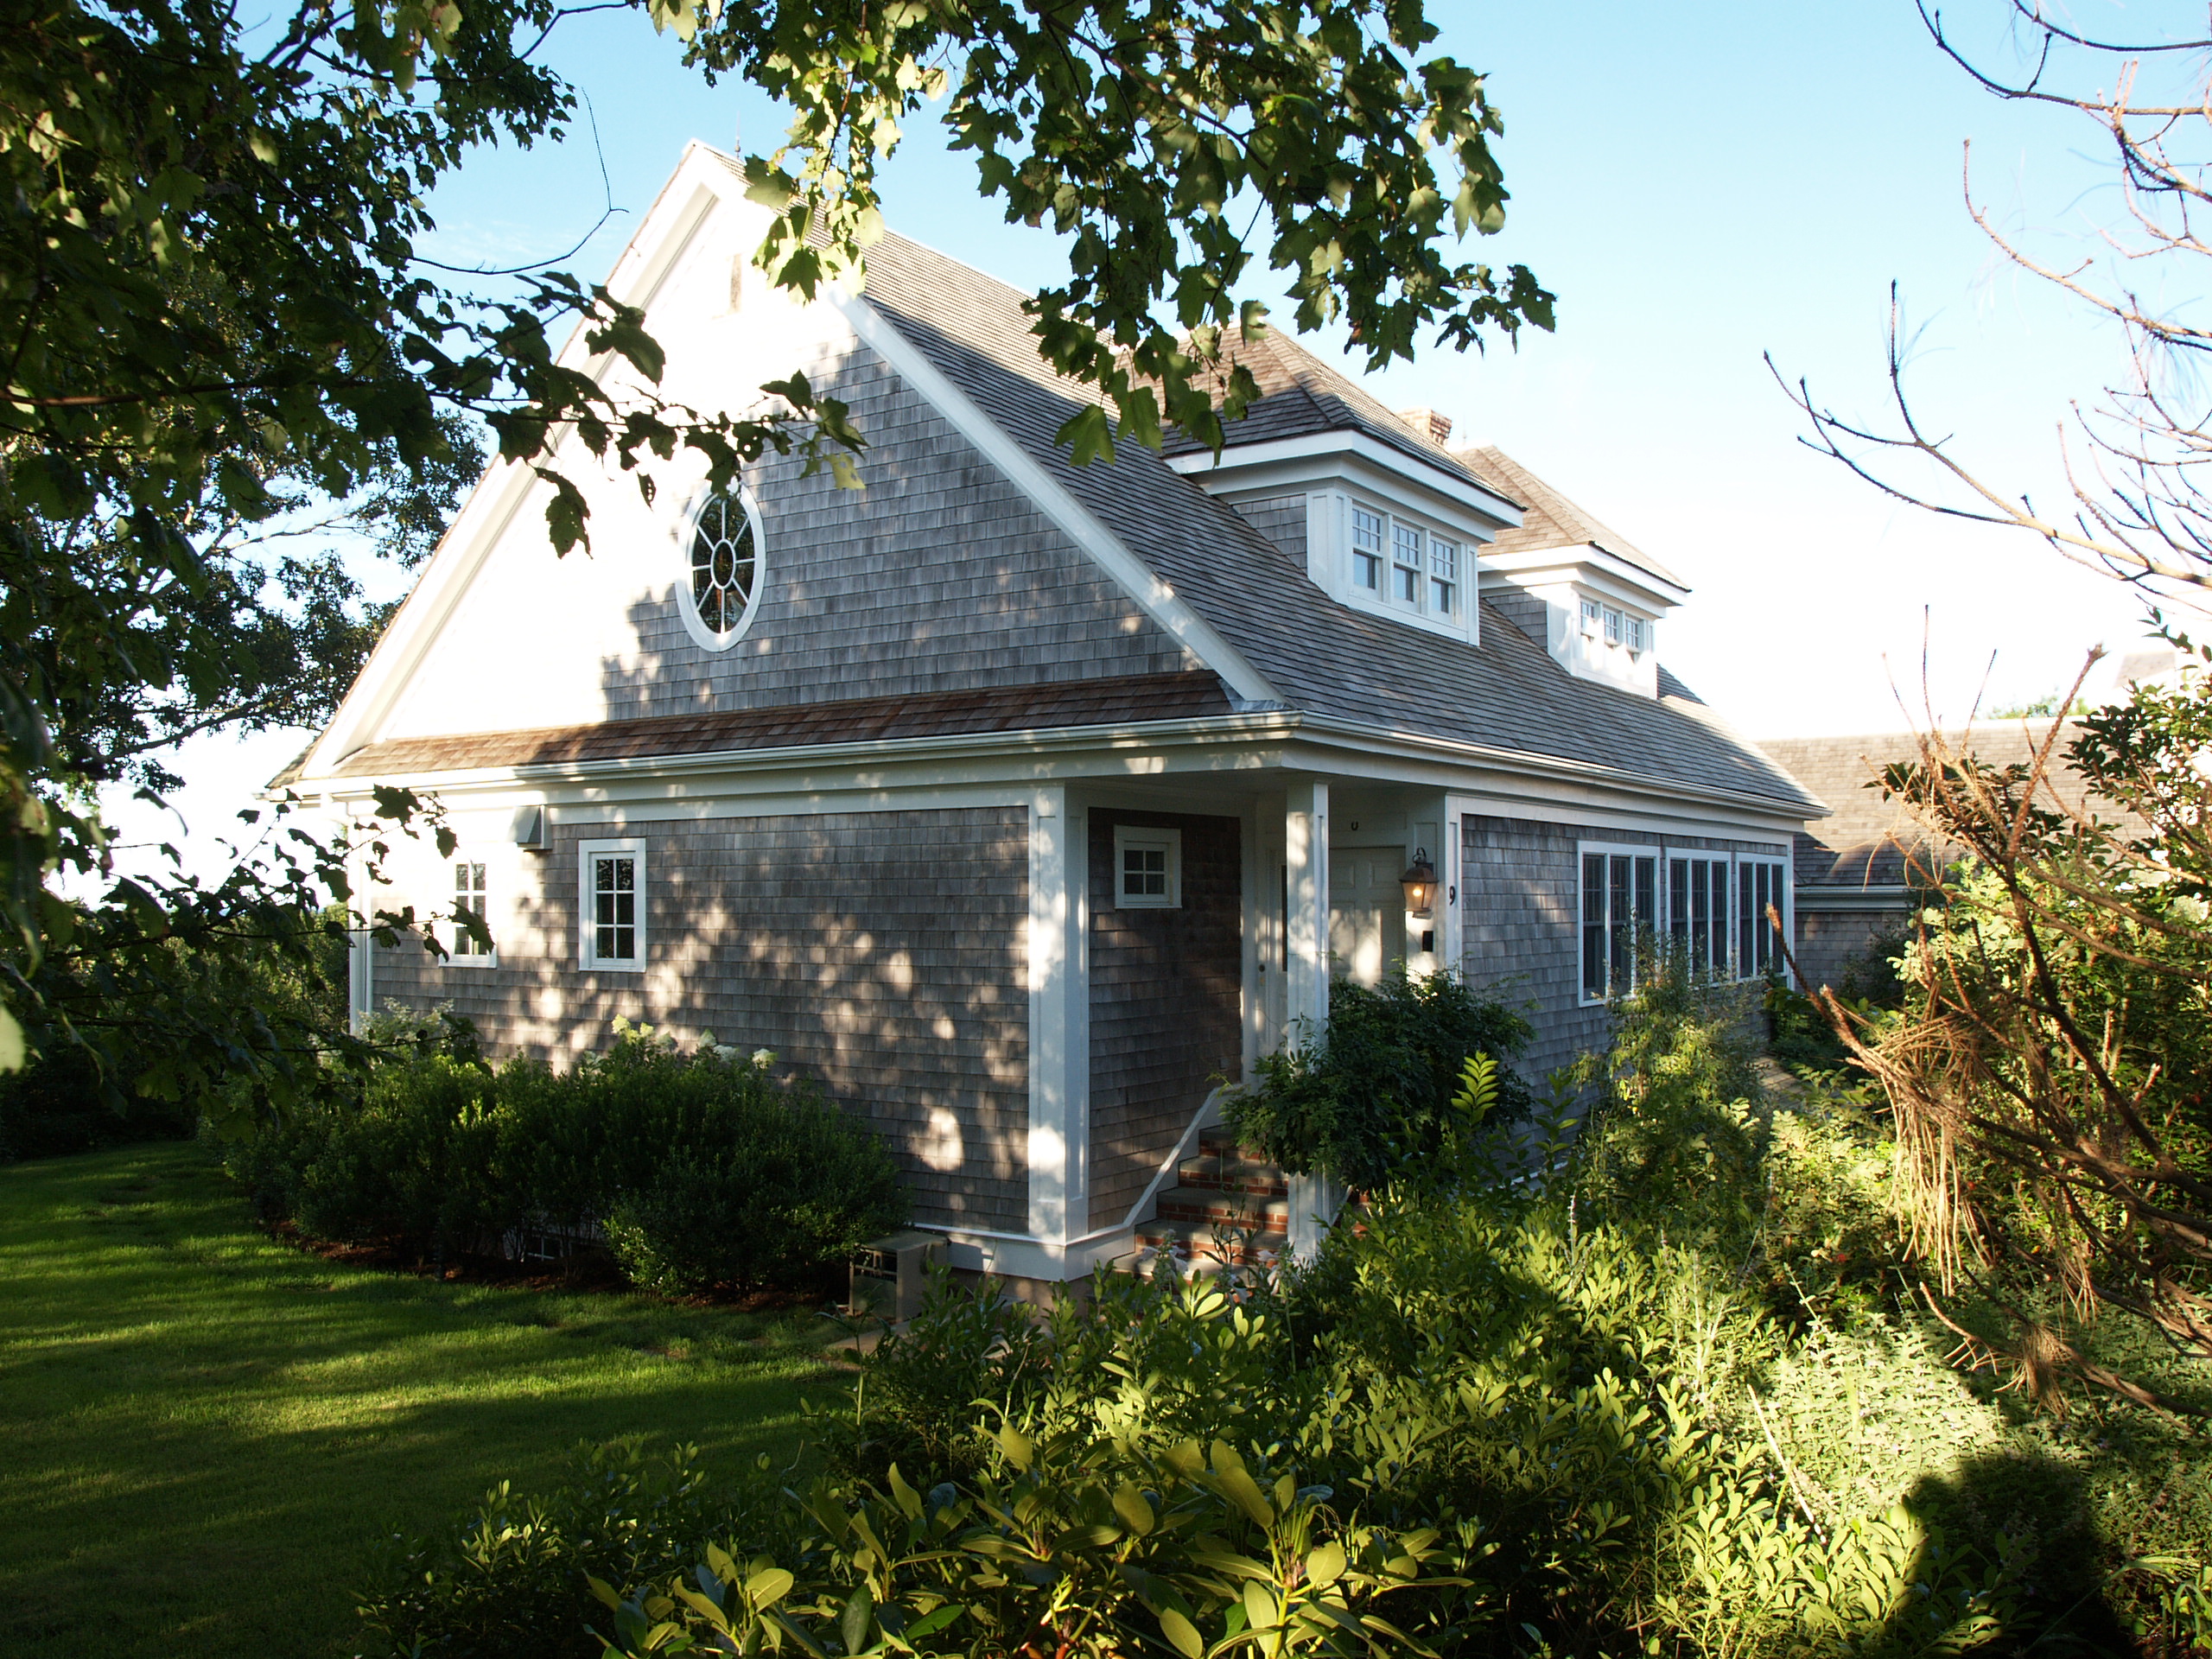
There are 53 single family homes on the market with an average asking price of $1.436M, and with an average of 4 bedrooms 4 baths and 2,610 square feet. Three of our favorites are pictured below. 29 Tremont Street is one of the most charming properties in town. Nestled on the corner of Tremont Street and Atwood Street, the 4 bedroom 3 bath property consists of an antique colonial main house and a perfect 1 bedroom cottage in the rear. 10 R Commercial Street is another great property hidden behind the Delft Haven with a main house and a charming guest house and beautiful grounds. 7 Telegraph Hill is a spectacular hilltop home with 3 bedrooms and 3.5 baths, and is one of the properties I mentioned in a prior post about Telegraph Hill.
These homes represent the best of Provincetown on so many levels. Each is a significant quality property that speaks to the interest and excitement that exists for real estate here on our wonderful town.


$2.896M
That’s the mid summer update here in Provincetown. Sales are on track to come close to or meet last years records, and if last weeks activity is a predictor we certainly will come close. Call or stop in to say hello when you are in town. Our office is at 139 Commercial Street in the West End.