Categories
analytics general info

Massachusetts Tops In Listing Prices, Provincetown Is Higher!

Scott always has good posts. This one is surprising showing MA is #1, (in the continental US) or #2 in  the whole USA when it comes to the average listing price for single family homes. To put that in context, Provincetown’s average singe family listing price today is $1.378M, more than twice the state average.

High listing Prices? Massachusetts has them beat!

Posted by Scott Van Voorhis

Basically, the good old Bay State is No. 1 in the continental U.S. when it comes to the listing price of a typical four-bedroom, two-bath suburban home, Coldwell Banker finds in a new survey.

The average listing price here is pushing half a million at $489,063 for your basic subdivision home. That’s far above the national average, which weighs in at $292,152.

Now to be clear here, Hawaii ($742,551) actually has the highest listing price for the entire country, but given the obvious land constraints of the island state, it’s a little like comparing apples and oranges.

Interestingly, Massachusetts listing prices even beat out California ($431,625), New Jersey ($425,625) and Connecticut ($411,884), which has the hedge fund capital of the world in Stamford.

We also have more than are our share of spots in the top 100 when listing prices for two-bedroom, two-bath homes are broken down by individual towns and cities.

With an average listing price of $1.1 million for a two-bedroom, two-bath home, Weston ranks No. 14 in the country. But Los Altos in Silicon Valley has anything in Massachusetts beat, with an average listing price of $1.7 million.

So what’s happening here? We are heading into our third decade here in Massachusetts of anemic construction of suburban, single-family homes, with no change in sight.

In fact, Gov. Deval Patrick’s belated proposal to tackle the growing mismatch between supply and demand in the Bay State housing market focuses almost exclusively on construction of apartments, townhomes and condos.

The problem is well-paid professionals who relocate here to take jobs in our growing biotech and high-tech fields aren’t selling their spacious 4,000-square-foot colonials in Texas and North Carolina and saying gee, can’t wait to move into a tiny 1,100-square-foot condo next to a train station up in Massachusetts.

Instead they are bidding up whatever available suburban homes they can find within the 495 beltway, and, if they have the bucks, paying for teardowns in which new, outsized homes replace old capes and ranches in Concord, Wellesley, Hingham and other upscale suburbs.

OK, your turn on the soap box. What’s your take?


Categories
analytics general info

Mass. Home Sales Up 22% YTD

Todays very positive Boston Globe real estate headline.

By Jenifer B. McKim

|

GLOBE STAFF

Buyers snapped up more than 4,000 single-family homes in Massachusetts last month, pushing the number of statewide sales for the first 10 months of 2012 above the total for all of last year.

Warren Group, a Boston real estate tracking company, reported Tuesday that home sales in October increased by 21 percent, to 4,044, compared with the same month last year, reflecting increased optimism about the state’s housing market.

Sales between January and October rose to 39,491, a 22 percent increase compared with those months in 2011.

“Record low mortgage rates, an improved economy, and growing consumer confidence are boosting the housing market in Massachusetts and around the country,” said Timothy M. Warren Jr., Warren Group’s chief executive.

The median home price remained relatively flat, however. For a single- family home, it held at $270,000 in October, similar to 12 months earlier, Warren Group said.

Between January and October, the median value slipped to $287,500, down nearly 1 percent compared with October 2011. That means half the properties sold above that price and half sold for less.

The state’s condominium market fared slightly better.

Condo sales were up 48.8 percent in October, compared with the same time last year. The median price rose to $255,000, less than 1 percent higher than October 2011.

Between January and October, the median price for condos went up slightly to $275,000, less than 1 percent higher than a year earlier.

The Massachusetts Association of Realtors, which also released data on Tuesday, offered slightly better housing numbers.

The association said that the median value of a single-family home increased modestly in October to $287,000, 4.4 percent above the October 2011 median.

The median condo price rose to $265,000, up 2 percent compared with that month last year.

The association tracks data from three affiliated listing services, while Warren Group bases its numbers on sales filed at registries of deeds.

As more prospective buyers took action, the number of available homes continued to drop. The inventory of single-family homes decreased by 23.5 percent in October 2012, compared with the same month last year, and the number of condos for sale declined by 32.2 percent, compared with October, 2011, the association said.

John Ranco, a senior sales associate with Hammond Residential Real Estate, said he hopes more people list their homes for sale in the new year, in anticipation of the traditionally busy spring selling season. Right now, Ranco said, many buyers remain frustrated.

“There is very little to choose from,” he said.

Housing numbers released Tuesday by the S&P/Case-Shiller Home Price Indices showed Boston-area home prices increased by 1.9 percent in September, compared with that month last year.

Nationwide, home values rose about 3.6 percent in September, compared with 2011, according to the index, which measures repeat sales of the same properties and is considered one of the best measures of the nation’s housing market.

David M. Blitzer, chairman of the index committee at S&P Dow Jones Indices, said the latest figures provide further evidence that the housing market is ascending.

“With six months of consistently rising home prices, it is safe to say that we are now in the midst of a recovery in the housing market,’’ Blitzer said.

Jenifer B. McKim can be reached at [email protected]. Follow her on Twitter @jbmckim.

Categories
analytics

NAR Report Prices Rise In Q3

Below is a great Agent Genius post putting perspective on the national real estate market.

by  in EconomyNews – Agent Genius 

 New data shows strength of prices rising

According to the latest quarterly report by the National Association of Realtors, growth in metropolitan area median home prices increased in the third quarter, and more areas are showing gains. The median existing single-family home price rose in 120 out of 149 metropolitan statistical areas (MSAs) based on closings in the third quarter compared with same quarter in 2011, while 29 areas had price declines, up from 110 areas with annual improvement in the second quarter. In the third quarter of 2011, only 39 metros improved, marking stronger home increases.

Dr. Lawrence Yun, NAR’s Chief Economist, said in a statement, “Housing inventories have been gradually trending down from a record set in the summer of 2007,” he said. “Earlier this year, a broad equilibrium began to develop in most areas between home buyers and sellers, which led to a sustained upturn in home prices. We expect fairly normal appreciation patterns in 2013, but there is a risk of price acceleration if builders are unable to increase supply to meet the needs of our growing population and household formation.”

The national median existing single-family home price was $186,100 in the third quarter, up 7.6 percent from $173,000 in the third quarter of 2011, which is the strongest year-over-year price increase since the first quarter of 2006 when the median price rose 9.4 percent. In the second quarter the price increased 7.2 percent from a year earlier.

The median price is where half of the homes sold for more and half sold for less; medians are more typical than average prices, which are skewed higher by a relatively small share of upper-end transactions.

Some of the price gain resulted from a smaller share of distressed home sales in the market, but the higher prices significantly reflect a market recovery. Distressed homes accounted for 23 percent of second quarter sales, down from 30 percent a year ago.

A separate breakout of income requirements to buy a home on a metro area basis shows buyers in the vast majority of areas had ample income in the third quarter, assuming they could meet stringent mortgage credit standards.

Total existing home sales rose 3.2 percent

Total existing-home sales rose 3.2 percent to 4.68 million in the third quarter from 4.54 million in the second quarter, and were 10.3 percent higher than the 4.25 million pace during the third quarter of 2011. At the end of the third quarter, 2.32 million existing homes were available for sale, which is 20.0 percent below the close of the third quarter of 2011 when 2.90 million homes were on the market.

According to Freddie Mac, the national commitment rate on a 30-year conventional fixed-rate mortgage averaged a record low 3.54 percent in the third quarter, down from 3.80 percent in the second quarter and 4.31 percent in the third quarter of 2011.

NAR President Moe Veissi said affordability conditions are a big factor in rising sales. “Historically low mortgage interest rates are encouraging many buyers who were on the sidelines,” he said. “Sales this year are notably higher than the levels seen in 2008 through 2011, so we’re clearly in a recovery phase with rising sales, declining inventory and rising prices. Of course the recovery would be stronger and more stable if we could return to safe but sensible mortgage underwriting standards.”

First time buyers.

First-time buyers purchased 32 percent of all homes in the third quarter, down from 34 percent in the second quarter; they were 32 percent in the third quarter of 2011.

The share of all-cash home purchases was 27 percent in the third quarter, down from 29 percent in the second quarter and 29 percent in the third quarter of 2011. Investors, who make up the bulk of cash purchasers and compete with first-time buyers, accounted for 17 percent of all transactions in the third quarter, down from 19 percent in the second quarter and 20 percent a year ago.

“The modest decline in first-time buyers and investors shows the impact of limited inventory in the lower price ranges from a shrinking share of distressed homes, which are popular with both of these groups,” Yun explained.

Regional performance varied

Regionally, existing-home sales in the Northeast increased 1.7 percent in the third quarter and are 9.8 percent above the third quarter of 2011. The median existing single-family home price in the Northeast slipped 0.3 percent to $246,900 in the third quarter from a year ago.

In the Midwest, existing-home sales rose 5.2 percent in the third quarter and are 17.8 percent higher than a year ago. The median existing single-family home price in the Midwest increased 4.2 percent to $151,100 in the third quarter from the same quarter in 2011.

Existing-home sales in the South increased 5.4 percent in the third quarter and are 11.7 percent above the third quarter of 2011. The regional median existing single-family home price rose 5.7 percent to $165,400 in the third quarter from a year earlier.

In the West, existing-home sales slipped 1.2 percent in the third quarter due to limited supplies, but are 2.1 percent higher than a year ago. With the tight inventory, the median existing single-family home price in the West surged 20.2 percent to $247,400 in the third quarter from the third quarter of 2011.

Categories
general info

Local Market Performs Counter to National Trends

Regionally, existing-home sales in the Northeast fell 6.3 percent to an annual level of 590,000 in September but are 7.3 percent above September 2011. The median price in the Northeast was $238,700, up 4.1 percent from a year ago. (see post below)

How do our hyper-local markets stack up to national and regional stats for September?

In Provincetown condo sales increased 115% month over month from 8 sales in 2011 to 22 sales in 2012! The average sale price increased by 8% to $438K, and average days on market decreased by almost half to 193 days!

In downtown Boston the condo market performed differently in September. The number of sales increased 14% month to month to 333 from 292. The average sale price for condos decreased 6% to $525K from $558K, and the median price decreased 3% to $405K. Inventory decreased by almost half to 859 properties on the market vs 1515 last year.

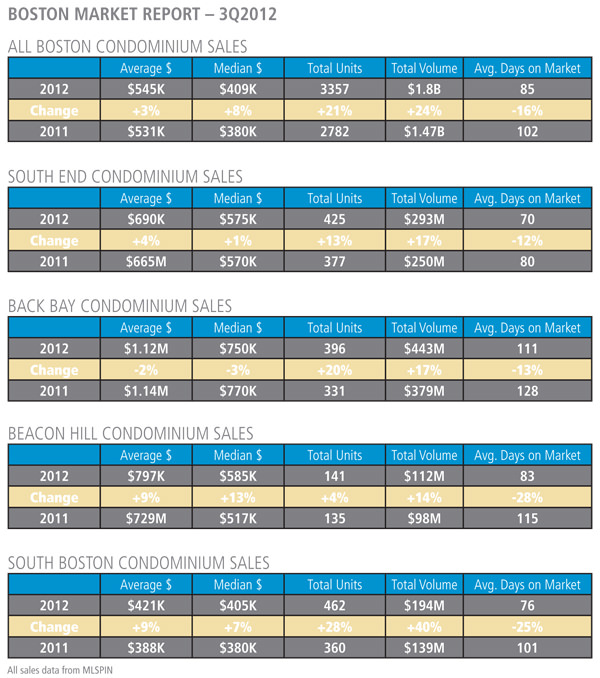
So locally, which for me is Boston and Provincetown, sales are way up, prices are mixed, and inventory  is way down. Quite contrary to regional and national figures.  Go figure!

One of my favorites from  AGBeat blog, Tara Steele posts her regional and national analysis below.

by  in EconomyNews 

Home sales down, prices up

According to the National Association of Realtors (NAR), September existing-home sales dropped 1.7 percent as inventory levels continue to tighten, also reporting that the median home price jumped up, the first time since November 2005 to May 2006 that prices rose for seven months consecutively.

Existing home sales may have dipped slightly, but are up 11.0 percent from September 2011. The national median existing-home price hit $183,900, up 11.3 percent from September 2011.

Dr. Lawrence Yun, NAR chief economist, said the market trend is up. “Despite occasional month-to-month setbacks, we’re experiencing a genuine recovery,” he said. “More people are attempting to buy homes than are able to qualify for mortgages, and recent price increases are not deterring buyer interest. Rather, inventory shortages are limiting sales, notably in parts of the West.”

Housing inventory and distressed sales

According to Freddie Mac, the national average commitment rate for a 30-year, conventional, fixed-rate mortgage fell to a record low 3.47 percent in September from 3.60 percent in August; the rate was 4.11 percent in September 2011.

Distressed homes accounted for 24.0 percent of sales in September (13.0 percent were foreclosures and 11.0 percent were short sales), up from 22 percent in August; they were 30 percent in September 2011. Foreclosures sold for an average discount of 21 percent below market value in August, while short sales were discounted 13 percent.

Total housing inventory at the end September fell 3.3 percent, representing a 5.9-month supply at the current sales pace, down from a 6.0-month supply in August. Listed inventory is 20.0 percent below a year ago when there was an 8.1-month supply.

“The shrinkage in housing supply is supporting ongoing price growth, a pattern that could accelerate unless home builders robustly ramp up production,” Dr. Yun said.

Median time on market down 30%

The median time on market was 70 days in September, unchanged from August, but down 30.7 percent from 101 days in September 2011. Fully 32.0 percent of homes sold in September were on the market for less than a month, while 19 percent were on the market for six months or longer.

NAR President Moe Veissi said some buyers who could easily afford a mortgage can’t assume they’ll get one. “Home buyers need to be more focused on the mortgage process in the current environment where lenders and banking regulators are being risk averse,” he said, recommending that buyers shop for competitive mortgage terms.

First time buyers coming back

First-time buyers accounted for 32.0 percent of purchasers in September, compared with 31.0 percent in August; they were 32.0 percent in September 2011.

All-cash sales were at 28 percent of transactions in September, up from 27 percent in August; they were 30 percent in September 2011. Investors, who account for most cash sales, purchased 18 percent of homes in September, unchanged from August; they were 19 percent in September 2011.

Single-family home sales declined 1.9 percent to a seasonally adjusted annual rate of 4.21 million in September from 4.29 million in August, but are 10.8 percent higher than the 3.80 million-unit level in September 2011. The median existing single-family home price was $184,300 in September, up 11.4 percent from a year ago.

Existing condominium and co-op sales were unchanged at a seasonally adjusted annual rate of 540,000 in September, but are 12.5 percent above the 480,000-unit pace a year ago. The median existing condo price was $181,000 in September, which is 10.0 percent higher than September 2011.

Regional performance varied

Regionally, existing-home sales in the Northeast fell 6.3 percent to an annual level of 590,000 in September but are 7.3 percent above September 2011. The median price in the Northeast was $238,700, up 4.1 percent from a year ago.

Existing-home sales in the Midwest slipped 0.9 percent in September to a pace of 1.10 million but are 19.6 percent higher than a year ago. The median price in the Midwest was $145,200, up 7.0 percent from September 2011.

In the South, existing-home sales increased 0.5 percent to an annual level of 1.93 million in September and are 14.2 percent above September 2011. The median price in the region was $163,600, up 13.1 percent from a year ago.

Existing-home sales in the West fell 3.4 percent to an annual pace of 1.13 million in September but are 0.9 percent above a year ago. With continuing inventory shortages in the region, the median price in the West was $246,300, which is 18.4 percent higher than September 2011.

Categories
architecture general info

44th Annual South End House Tour

Get a Glimpse Inside the South End’s Coolest Homes on the South End House Tour

This year’s South End House Tour will take place on Saturday, Oct. 20.

by Sara Jacobi…South End Patch

It’s a little bit like the History Channel meets HGTV. Right in your backyard.

Get a peek into several of the South End’s historically notable or highly designed homes on the 44th annual South End House Tour, put on by the South End Historical Society.

The tour, to be held on Saturday, Oct. 20 from 10 a.m. to 5 p.m., is a self-guided walk through six amazing South End homes starting at the Southwest Corridor and ending mid-way down Shawmut Avenue. Since the tour is at-your-own-pace and snakes around on a more than 1 mile path, the full tour can take anywhere from two to four hours. It starts at the Boston Center for the Arts.

South End Historical Society Executive Director Hope Shannon said the idea for the house tour began more than four decades ago as a way to showcase the creativity and history of the neighborhood.

“People were buying a lot of run down or abandoned buildings in the South End and restoring them,” she said. “The neighborhood was much different back then.”

Today, the tour seeks to showcase all sorts of notable homes, from the historical, to the “green,” to the homes with unique architecture or high design.

Special to the 2012 tour is a combination deal with the Ellis Memorial Antique Show, which will be held at the Cyclorama on the same day. A ticket to the house tour comes with a complimentary admission to the antiques show. This year’s tour will also feature a stop inside the New Hope Baptist Church, which will soon be turned into condo apartments.

Shannon said that besides serving as a significant fundraiser for the historical society, the house tour’s main goals are to continue bringing people into the South End and to showcase the neighborhood’s history and charm.

“The neighborhood has changed so much, and the homes have so much history,” she said. “We want to remind people of the long history and bring awareness for continued preservation. We want visitors to leave with positive memories of the people they meet and the businesses they patronize, and recognize the South End is an important place historically.”

Tickets are on sale now through Oct. 19 for $25, and can be purchased online at the Historical Society’s website or through several different realtors in the neighborhood. Tickets will also be on sale on the day-of for $30 each. A $50 ticket includes admission to a private party at an additional house. 

Related Topics: south end historical society and south end house tour

Categories
analytics general info

Boston Q3 Condo Sales Review

The Big Number is 21%. That’s the increase in condo sales year over year at the end of the 3rd quarter, September 30. Combined, all Boston neighborhoods saw a 21% increase in the number of condo sales year to date, a 3% increase in the average price of a condominium sold to $545K, and an 8% increase in the median sales price to $409K. This real estate market is healthy except for the continuing decrease in inventory levels. Inventory levels of available condo’s for sale have fallen 41% to 919 properties for sale versus 1,567 at this time last year.

The Back Bay,  saw a 20% increase in sales year to date, but the average price  of a condo sold dropped by 2% to $1.120M. The inventory level of condos for sale dropped 53% to 95 condos for sale vs 204 last year.

The South End saw a 13% increase in the number of condo sales to 425 condos sold year to date compared to 377 last year.  The average price of a condo sold increased 4% to $690K compared with $665K last year. The inventory of condos for sale decreased 52% from 173 last year to 83 today. This will continue to be a factor in market performance going forward.

South Boston saw a 28% increase in the number of condo sales year to date compared with 360 last year. The average sales price of a condo increased by 9% to $421K compared with $388K last year.  South Boston has the largest drop in inventory of all downtown n’hoods down 60% from 196 properties for sale last year to 78 available for sale today.

Inventory remains the problem, but as I have said repeatedly this market is so resilient and so desirable that declining inventory levels have not negatively effected the steady increase in sales and prices. Go figure!


Categories
analytics general info

Lack of Inventory In Boston Getting Serious

My good friend, excellent agent and blogger Briggs Johnson at Coldwell Banker Residential Brokerage hits it squarely on the mark with this post which illustrates the decrease in inventory year over year and its potential effect on the market. I have posted it in its entirety below. Visit his blog. 

September 18, 2012 By 

“The Caravan Indicator”

There are several indicators and indexes that people follow to determine market conditions.  The indicator I am going to use that sparked this blog entry is  going to called the “Caravan Indicator”. What many people don’t know is that behind the scenes here at Coldwell Banker (downtown), every few weeks, we hire a bus to drive us all around town to check out new listings in Back Bay, Beacon Hill, South End, South Boston and the Seaport District etc. Its a great way for us to view new inventory and for us to be knowledgeable of the market in all price points. Today, is caravan day and it was cancelled due to lack of inventory…..Wait, What?! I can understand there being a cancelled caravan in late fall or August when everyone is on vacation, but not now, not September, not in the second week of the second strongest time of year to get new inventory. Really?

I was ready to bounce around the city and view some properties, but, since that wasn’t happening, I did some research to see how limited inventory really is. I went on MLS and looked up current inventory, the amount of listings currently under agreement and the amount of listings that have been sold in the past 2 months. The numbers don’t lie and I found them pretty shocking. Since I really only focus on the downtown neighborhoods. I used the 4 neighborhoods i do a lot of business in . Here are the Stats:

Neighborhood         # of Listings    # Under Agreement      # Sold in last 2 months

Back Bay                            104                                  57                                   124

South End                          78                                   57                                    110

Beacon Hill                        59                                  14                                      41

Seaport District               16                                  7                                        23


Last Year (2011)              # of Listings                          % Decrease from 2011

Back Bay                                213                                                           52%

South End                             183                                                           58%

Beacon Hill                            82                                                             28%

Seaport District                   37                                                             57%


The way I look at this information is that it is a great time to sell and list a property. There are a ton of buyers out there and they are in desperate need of decent inventory. On the flip side, If you are a buyer looking in these neighborhoods, be prepared to be frustrated and be ready to enter a multiple offer situation (if you are a serious buyer looking in a popular area). In the South End alone there have been 24 places go under agreement in the past 2 weeks.  If you are a buyer looking in the South End under $450k. there are only 9 places on the market and only 3 of them are north of Washington Street. If you are a buyer looking in the 800-1 million range in the Back Bay, there are only 11 listings on the market.  Six of those listings have been on the market for over 100 days, so quality is as compromised as quantity right now. If you are a Beacon Hill buyer looking from 600-900k there are only 3 listings on the market. 2 of those listings have been on the market for over 170 days. Brutal!!

I can understand that sellers are hesitant to list because there  isn’t much to move into if they sell and want to stay in downtown Boston. But if you are a possible seller looking to move out of state or to the “burbs” this could be an ideal time to make the jump.

I know all downtown agents are saying “list your property now” but hopefully some of this data, makes you think about the scenario with a different tone. Have hope and don’t be afraid to enter the market, just be informed and realistic.

Happy Hunting and Start Listing!!


Categories
general info

Are Buyers Bummed Out In Boston?

Scott at Boston.com comes up withe some great posts and I have posted another one below. Scott talks about a Redfin survey that finds only 46% of buyers surveyed  think it is a good time for house hunting. This is apparent as well in all anecdotal information from the field specifically in downtown Boston. The issue remains lack of good available inventory and the impact that this will have in the “nascent real estate recovery. Jon

Posted by Scott Van Voorhis  September 4, 2012 07:59 AM

So says Redfin in a troubling new survey of buyers in 19 major metro markets across the country, including Boston.

Fewer than half the buyers out there – 46 percent – actually believe it is a good time to be house hunting, according to the online brokerage firm.

That’s a big shift from the first quarter, when hopes for deals and bargains was much higher among buyers as the spring sales season approached. Back then, 56 percent said it was good time to buy, Redfin notes.

However, probably the most dramatic change is in buyers’ expectations of where home prices are headed. The number of buyers who believe home prices are headed up has nearly doubled, to 61 percent from 32 percent in the first quarter.

So what’s made home buyers so glum?

Well bidding wars haven’t helped, with seven out of 10 buyers reporting they had encountered multiple bids on at least one offer, according to Redfin.

In fact, 31 percent of those surveyed said they would back off if confronted with another bidding war, up from 28 percent this spring.

Of course, at the root of the problem is a falling supply of homes for sale, a phenomenon that has endangered the nascent real estate recovery both here in Greater Boston and across the country.

Fewer choices have meant more bidding wars, rising prices and increasingly grumpy buyers. (The Redfin survey is based on the responses of 829 buyers during the week of Aug. 16-22.)

And the stumbling economy – and all those storm clouds over Europe’s rickety banking system – hasn’t helped cheer buyers up either.

The percentage of buyers worried about the economy rose to 27 percent from 20
percent in the first quarter.

We’ll just have to wait and see what the fall selling season brings, I guess.

Categories
analytics general info

More Evidence That Home Prices Have Hit Bottom.

Great article in the WSJ. Nick Timiraos does a great job in putting things in perspective.

By Nick Timiraos of The Wall Street Journal

In each of the last three years, home prices have increased in the spring and summer, when more people are buying homes, before giving back all of those gains and then some in the fall and winter, when activity cools.

But it is beginning to look like that might not happen this year, absent a major stumble for the economy.

Home prices in July were up by 3.8% from one year ago, the largest year-over-year jump in six years. Moreover, prices have shot up by 9.6% from February, when they registered their lowest levels of the housing downturn, according to CoreLogic CLGX +0.40% data released Tuesday.

This adds evidence to the case that U.S. home prices may have hit bottom earlier this year. Even though prices will soften in the autumn, “we have a much better supply and demand dynamic” than in previous years, said Mark Fleming, chief economist at CoreLogic.

So when people say they believe home prices haven’t reached a bottom—that this year’s seasonal gains will be wiped away by January or February of next year—here’s the relevant question: Will home prices fall by 9.6% in the next six months?

Anything, of course, is possible. Home prices fell in the winter—what Mr. Fleming calls the “offseason”—in each of the last three years to record a new low. But they have not fallen by 9.6% in any six-month span since March 2009, which was when the U.S. economy was still in recession.

That’s the good news. Here’s the bad news: While the year-over-year comparisons look good right now, the economy—and workers’ wages—aren’t growing fast enough to justify this kind of increase on a sustained basis.

Instead, the snapback in home prices in the last six months is more an indication of how prices “over-shot” over the past year. Investors, sensing deals, began buying up homes. The most likely scenario for home prices over the next year is that they may rise, but not at the breakneck pace of the past few months (and they’ll fall on a relative basis in the coming months due to normal seasonal factors).

There are other serious headwinds. It’s still hard to get a mortgage, and many households have too much debt. Millions of homeowners owe more than their homes are worth. Millions more have enough equity to sell their house but not enough to make a down payment on their next house and pay a real-estate broker’s commission.

As we’ve written many times before, the strong rise in home prices this year owes as much to sharp declines in inventory as it does to demand-side improvement. Banks have been much slower to take back and list foreclosed properties, easing pressure on home prices but leaving a bloated “shadow inventory” of potential foreclosures.

These homes will weigh on markets for years, though there’s less evidence that they will be dumped on the market at once. While the shadow inventory may not lead to a big drop in prices that some have feared, it will probably keep a lid on future home-price gains.

Finally, lower mortgage rates have dramatically increased the purchasing power of today’s home buyers when compared to one year ago. Some real-estate executives are nervous that demand isn’t stronger given today’s low mortgage rates, and they’re worried about what will happen if rates rise.

The bottom line: Don’t be surprised if the all-time low in home prices is in the rearview mirror. But this doesn’t mean a full-on recovery is here, and there’s little evidence that the current pace of improvement can continue. For now, home prices appear to be bumping along a bottom.

Follow Nick @NickTimiraos


Categories
general info

Condo Association Hints

We recently had a closing where the buyers had always owned single family homes and never a condominium, so didn’t have any idea of how Condo Associations worked. So…an HOA (home owners association) primer follows. Yes, condo documents are boring, association meeting notes are boring, budgets are boring… but get to know your new new homeowners association! Don’t be surprised by assessments, crazy leadership, unreasonable rules..get to know your HOA and then work with your HOA to make your property a better investment. Below is a great post from Inman News.

Inman News

Here are a few guidelines for buyers-to-be and new owners of condos and other properties in HOAs:

1. Read the HOA disclosures — thoroughly. When you get into contract on a home that is located within an HOA, you receive a bulky stack of documentation about the association. It can be a mind-numbing, eye-twitch-inducing pile of bank account statements, historical documents and legalese. However, these materials are uber-important, as they provide the details and contours of this new business and interpersonal relationship you are about to embark on with your neighbors.

Things like the HOA’s plans for ongoing maintenance and upgrades, the HOA budget, the cash they have in reserve — all these things have the potential to impact your household budget.

For example, if the building needs a new roof and there’s not enough cash to cover the costs, most HOAs have the power to levy a special assessment on each owner for their share of the cost! The fact that you own your place means you also own some share of the responsibility for the building. That’s what owning in an HOA is all about.

Additionally, as you’ve learned the hard way, there are loads of HOA guidelines that may impact your lifestyle and your plans for your home. I have received dozens and dozens of notes over the years from condo owners like yourself protesting HOA restrictions on everything from parking to pet size and even flooring material and paint colors! Yes, the place belongs to you, but when you buy into a condo you opt into following the guidelines the HOA has in place for ensuring every owner can enjoy their home and all can live in peace.

I suspect the fee of concern to you covers the management company’s processing of your plans for modifying your home to ensure their compliance with HOA and other guidelines.

The ideal here is to read these documents thoroughly as part of your decision-making about whether to buy the property while you still have time to back out of the transaction if you don’t want to be bound by the HOA’s strictures.

2. Read more casual HOA member documents. Along with the formal HOA disclosures, condo buyers often receive a set of more casual documents, including a copy of the building rules and regulations, and the community newsletters. In my experience, these documents can actually be even more telling than the formal ones in terms of previewing for you the daily experience of living in the community. Yes, you’re likely to see a fair amount of minutiae, like recipes and block party announcements.

But you’re also likely to see things like board meeting agendas with line items like discussions of whether to raise the HOA dues, and conversations about any concerning, large repairs that might need doing. If you haven’t read these documents yet, you should now, to prevent further nasty or costly surprises.

In the same vein, I encourage condo buyers and new owners to talk with the building manager about common complaints and community issues (including fee increases) that are on the horizon, as well as connecting with other homeowners in the building or complex about their experience and any surprise costs or unpleasant rules they have encountered.

3. Participate in your HOA. Read the agendas of your HOA’s board meetings before they happen, attend the meetings and even participate on your board if possible. HOA boards ultimately have the power to impose dues increases, select the accounting and insurance vendors whose work and fees are so critical to the costs of living in the community, and select the contractors who do major building and community upgrades and repairs.

If you have a very strong issue with fees or rules that are currently governing your experience as a homeowner, the best way to address them is to become a vocal, active participant in your HOA board.