Categories
analytics general info

February MAR Report

 The Massachusetts Association of REALTORS® (MAR) reported today that February pending home sales were positive for the 22nd straight month compared to the year before, but winter weather kept gains modest. Pending sales figures (also called homes under agreement) are a leading indicator of actual housing sales in Massachusetts for the following 2-3 months.

“While we were still in positive territory, the combination of low inventory and several weekends snow storms, including a blizzard, kept buyer activity relatively minimal in February,” said 2013 MAR President-Elect Peter Ruffini, regional vice president at Jack Conway REALTORS® in Norwell. “After a ‘non-winter’ in 2012, the fact that pending home sales were still up in February is a good sign for the market.”
The number of single-family homes put under agreement in February was up 1.1 percent compared to the same time last year (3,041 homes in 2012 to 3,075 homes in 2013). This is the 22 nd straight month of year-over-year increases. On a month-to-month basis, single-family homes put under agreement were flat compared to 3,076 homes put under agreement in January 2013.
The number of condos put under agreement in February was up 11.9 percent compared to February 2012 (1,146 units in 2012 to 1,282 units in 2013). This is the 22nd straight month of year-over-year increases. On a month-to-month basis, condos put under agreement went UP 5 percent from 1,216 units in January 2013.


Categories
general info

NAR Report For February- Prices And Inventory All Post Gains

February was a strong month for real estate. The Cape was effected by 4 weekend snow storms but Boston buyers scoffed at the weather and added momentum to sales in the New Year.

Existing-home sales, prices — and inventory — all post gains

NAR: Tight inventory still a drag on recovery

BY INMAN NEWS, THURSDAY, MARCH 21, 2013.

Inman News®

<a href="http://www.shutterstock.com/pic.mhtml?id=117398371" target="_blank" rel=Housing trends image via Shutterstock.” width=”225″ />

Existing-home sales and prices posted strong year-over-year gains in February, while inventory remained tight but eased slightly, according to a monthly report released today by the National Association of Realtors (NAR).

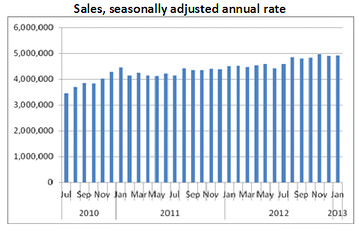
Existing homes, which include single-family, townhomes, condominiums and co-ops, sold at a seasonally adjusted annual rate of 4.98 million during February, up 0.8 percent from January and 10.2 percent from a year ago. That’s the fastest pace of sales since November 2009 when the first-time homebuyer tax credit boosted purchases.

The national median existing-home price remained level at $173,600 from January but was up 11.6 percent from a year ago, continuing a 12-month string of consecutive year-over-year price increases not seen since May 2006.

Existing-home inventory rose 9.6 percent from January to 1.94 million units in February but remained tight, at 19.2 percent below the inventory level from a year ago.

With the month-over-month growth, the months’ supply of inventory — the amount of time it would take to sell all homes now on the market at the current rate of sales — rose to 4.7 months, up from 4.2 months in January.

Some analysts view a six-month supply of homes as a more even balance of buyer and seller demand — anything less than that indicates a seller’s market.

NAR Chief Economist Lawrence Yun said that overall economy is resulting in increased demand, sales and prices. Despite rising prices, however, low mortgage rates are still attracting homebuyers, but tight inventory, he said, will continue to temper the housing turnaround.

The only headwinds (to a housing a recovery) are limited housing inventory, which varies greatly around the country, and credit conditions that remain too restrictive,” Yun said in a statement.


Source: Calculated Risk blog

Existing homes were on the market for a median of 74 days in February — up from 71 days in January and 24 percent below February 2012’s mark of 97 days.

First-time buyers accounted for 30 percent of purchases, unchanged from January.

Distressed homes accounted for 25 percent of all existing-home sales in February — down from 34 percent in February 2012 but up from January’s mark of 23 percent.

Foreclosures made up 15 percent of February’s existing-home sales and sold for an average of 18 percent below market value, while short sales, which made up 10 percent of February’s sales, sold for 15 percent below market value.

All-cash deals accounted for 32 percent of February’s sales, up from 28 percent in January. Investors accounted for 22 percent of existing-home sales in February.

Existing-home sales, February 2013

Seasonally adjusted annual rate 4.98 million
% change from February 2012 +10.2%
% change from January 2013 +0.8%
National median price $173,600
% change from February 2012 +11.6%
Unsold inventory (months’ supply) 4.7 months
Share of all-cash buyers 32%
Share of investor buyers 22%
Share of first-time buyers 30%
Share of distressed sales 25%

Source: National Association of Realtors

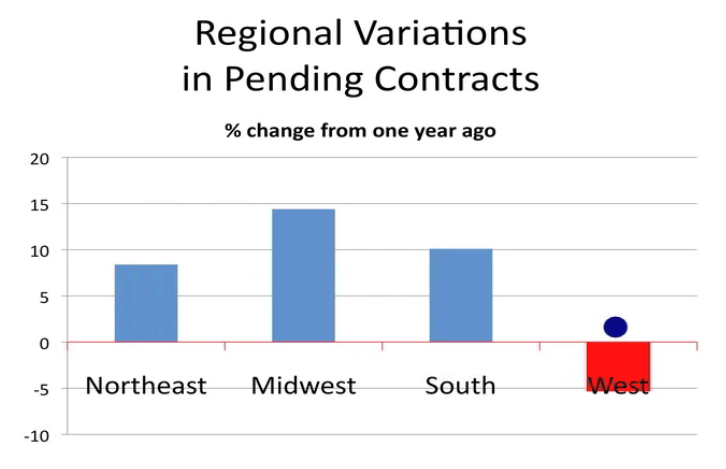
All regions saw year-over-year increases in existing-home sales with the South leading the way with a 14.9 percent jump in sales from a year ago to an annual rate of 2.01 million in February on a median sale price of $150,500.

In the Midwest, sales rose 12.9 percent from a year ago to an annual rate of 1.14 million with a median sale price of $129,900.

Existing-home sales in the Northeast were up 8.6 percent in February, year-over-year, to an annual pace of 630,000 units with a median sale price of $238,800.

The West saw February sales rise 1.7 percent from February 2012 to an annual rate of 1.20 million with extremely tight inventory and multiple bidding raising the median price, year-over-year, 22.7 percent to $237,700.

C7T45ARN5NQSR

Categories
analytics general info

Buying Cheaper Than Renting

Another great post from Tara Steele at Agent Genius. Buying is still cheaper then renting in most markets. An interesting national story.

by  in Housing News –   


trulia Buying now cheaper than renting in most housing markets

Rents up, home prices up, one still reigns

According to the Trulia Winter 2013 Rent vs. Buy Report, buying a home in the top 100 major metros is cheaper than renting, even in light of home prices rising. The company analyzes homes for sale and rent on the site from December 1, 2012 to February 28, 2013 factoring in transaction costs, opportunity costs, and taxes to uncover that although rents and home prices are both rising, home ownership is still more affordable. Trulia says buying a home is 44 percent cheaper than renting nationwide, down just slightly from 46 percent in 2012.

“Although buying a home is still cheaper than renting, the gap is closing,” said Dr. Jed Kolko, Trulia’s Chief Economist. “In 2013, home prices should rise faster than rents, and mortgage rates are likely to rise in the next year as the economy improves. By next year, buying could be more expensive than renting in some housing markets, even for people with the best credit.”

Housing affordability and mortgage rates

Asking home prices rose 7.0 percent year over year in February, which outpaced rents which rose 3.2 percent in the same period. Trulia reports that low mortgage rates (averaging 3.5 percent at the end of February) have kept homeownership costs from rising, and kept affordability high.

“Even in each of the 100 largest metros, buying is more affordable than renting with the range differing significantly from being 70 percent cheaper to buy than rent in Detroit, but only 19 percent cheaper in San Francisco,” Trulia reports.

The challenge that remains for housing

While a positive portrait of homeownership emerging, the stark reality is that many potential home buyers still won’t qualify for a mortgage under current lending conditions, and those that do qualify may not enjoy the lowest of rates unless their credit is near perfect.

That said, Trulia notes that “getting a higher rate does not mean homeownership is completely out of reach. Even with a 5.5 percent mortgage rate, buying a home is still cheaper than renting in almost every market. Only in San Francisco does homeownership become slightly more expensive than renting at the higher rate.”

Categories
analytics general info

January Sales At Highest In Five Years.

News from The Warren Group:

Bay State January Home Sales At Highest Level In Five Years

Condo Sales Break 1,000 Mark For First Time Since 2008

The Warren Group

The strong sales trend in January in just the beginning of a hot spring selling season. Timothy M. Warren Jr., CEO of The Warren Group, weighs in.

Single-family home sales in Massachusetts rose more than 10 percent in January to 2,680, reaching the highest level since 2007, according to new data from The Warren Group, publisher of Banker & Tradesman.

January home sales in the Bay State were up over last year’s 2,436 sales. This is the highest January sales volume for single-family homes in Massachusetts in five years, when there were 2,953 transactions in January 2007.

Jan2013MASalesChart

We ended 2012 on a pretty positive note, and this is carrying into January,” said Timothy M. Warren Jr., CEO of The Warren Group. “Recent pending sales data are a hopeful sign for a strong spring market. And given low mortgage rates and steady prices, there are positive signs that 2013 will be a second year of recovery.”

The median sale price of single-family homes in Massachusetts increased for the fourth consecutive month in January. Median sale prices rose 6.8 percent in January to $277,750, up from $260,000 in January 2012. This is the highest median home price for January in three years.

“Low inventory is slowly driving up prices. This should in turn give sellers more confidence to put their homes on the market,” Warren said.

Condominium sales statewide also rose in January, increasing almost 11 percent to 1,006 from 907 in January 2012. This is the first January since 2008 where home sales broke the 1,000 mark.

The median condo price in January slipped almost 2 percent to $240,000 from $244,500 in January 2012. This is the lowest price for condos statewide since 2009, when the median price was $209,900.

Categories
analytics general info

WSJ Calls A Sellers Market

Below is Nick Timiraos’s article in the Wall Street Journal. We are certainly seeing different degrees of this dynamic in our local markets.

Housing: It’s Becoming a Seller’s Market

By Nick Timiraos
National Association of Realtors

The National Association of Realtors said on Thursday what home buyers in many parts of the United States have known for months: it’s becoming a seller’s market.

The number of homes listed for sale in January fell by 4.9%, leaving 1.74 million properties on the market. That’s the lowest since December of 1999, when there were 1.71 million homes on the market. By contrast, there were 2.91 million homes on the market two years ago at this time.

After adjusting for seasonal factors, home sales rose by just 0.4% in January, to an annual rate of 4.92 million units. Still, that’s up from 9.1% one year ago.

The upshot is that there’s a growing pool of buyers chasing a shrinking supply of homes. If the trend holds, prices will keep going up. At the current pace of sales, it would take just 4.2 months to sell the current supply of homes available for sale, down from a 6.2 months’ supply one year ago.

While inventories typically increase in the spring, the Realtors’ group has expressed growing concerns that sales volumes are being held back by the lack of choice. This is good news for homeowners who have watched home prices drop over the last six years, but it’s bad news for buyers—and for anyone that makes their living selling real estate.

Inventory declines have been the most dramatic in California, Arizona, and other markets that witnessed some of the largest home price declines. Those cities have large numbers of underwater borrowers—people who owe more than their homes are worth—while many others may have equity but aren’t willing to sell because prices have fallen so far.

Investors have also been aggressive in buying up properties that are selling for less than their replacement cost.

National Association of Realtors

Home sales could rise to 5.2 million units this year, an increase of nearly 12% from last year, according to economists atGoldman Sachs GS +2.13%. They base their forecast on household formation and demographics, which both suggest rising demand for housing in the coming years, and affordability measures such as mortgage rates and home prices.

But the economists note that there’s a considerable amount of uncertainty that could make those targets hard to hit, particularly if there’s nothing for would-be buyers to purchase.

Follow Nick @NickTimiraos

Categories
analytics general info

Sales Edge Up In ‘Sellers Market’

USA TODAY article indicating national trend of sales being affected by low inventory.  Local implications will be explored in later posts.

Ray Goldbacher, USA TODAY10:32a.m. EST February 21, 2013

Sales of previously owned homes edged up in January, held back by a shortage of homes for sale, according to the National Association of Realtors.

Single-family home sales increased 0.2% to a seasonally adjusted annual rate of 4.34 million in January vs. 4.33 million in December, and 8.5% above the 4 million-unit level in January 2012.

The median single-family home price was $174,100 in January, up 12.6% from a year ago.

Lawrence Yun , NAR chief economist, said tight inventory is a problem and, as a result, “We’ve transitioned into a seller’s market in much of the country.”

“Buyer traffic is continuing to pick up, while seller traffic is holding steady,” he said. “In fact, buyer traffic is 40% above a year ago, so there is plenty of demand but insufficient inventory to improve sales more strongly.”

Homes available for sale at the end of January fell 4.9% to 1.74 million previously owned homes, a 4.2-month supply at the current sales pace, down from 4.5 months in December, and the lowest supply since April 2005, when it was also 4.2 months, the NAR said.

The inventory is 25.3% below a year ago, when there was a 6.2-month supply. The number of homes available for sale is at the lowest level since December 1999, when there were 1.71 million homes on the market, the Realtors said.

“We expect a seasonal rise of inventory this spring, but it may be insufficient to avoid more frequent incidences of multiple bidding and faster-than-normal price growth,” Yun said.

Sales rose in every region but the West.

Overall, sales of single-family homes, condos and townhouses were up 0.4% from December, at a seasonally adjusted annual rate of 4.92 million. That was up from a downwardly revised 4.90 million in December, and 9.1% above the 4.51 million-unit pace in January 2012.

Distressed homes — foreclosures and short sales — accounted for 23% of January sales, down from 24% in December and 35% in January 2012.

The median time on market for all homes was 71 days in January, down from 73 days in December and 28.3% below 99 days in January 2012.

Categories
analytics

Tight Inventories Effect Growth Prospects.

The Inman News article below provides interesting national context to the extreme lack of inventory in our local markets.

NAR: Pending sales dip from November to December

BY INMAN NEWS

Inman News®

Tight listing inventories are likely to constrain growth in 2013 home sales, the National Association of Realtors said in releasing a report showing that pending sales dropped 4.3 percent from November to December.

Despite the month-to-month drop, existing homes under contract were up 6.9 percent from a year ago, making December the 20th month in a row to see an annual gain in pending sales.

NAR’s Pending Home Sales Index, which represents existing-home contracts signed but not yet closed, rose to 106.3 in November before slipping to 101.7 last month. In April 2010, when the federal homebuyer tax credit was still in place, the index hit 111.3, but soon dipped back down.

An index score of 100 is equal to the average level of sales contract activity in 2001, the first year examined by the trade group and a year in which home sales fell in what’s considered a normal range for the current U.S. population. Contracts signed in a month typically close one or two months later.

Although NAR is projecting that home sales will pick up by 9 percent in 2013, tight inventory, paired with near-record low new-home construction levels, is an obstacle to more rapid growth.

The month-to-month dip in the pending sales is not a “statistical fluke,” Yun said, but signals a loss of momentum in home sales. The momentum, however, is inventory-related, he said — demand is still high.

New homes, Yun said, are the solution to the inventory challenge. “True relief to the inventory has to come from new home construction.”

Regionally, the West, with extremely tight inventory, was the only region to see a decrease in pending home sales in December from a year ago with a 5.3 percent drop.

December 2012 year-over-year change in pending sales of existing homes index by region

Source: National Association of Realtors

The Midwest, South and Northeast had year-over-year index increases of 14.4 percent, 10.1 percent and 8.4 percent, respectively, in December.

On a monthly basis, only Midwest’s index increased in December — 0.9 percent. The pending existing-home sales index fell in the West, Northeast and South from November to December 8.2 percent, 5.4 percent and 4.5 percent, respectively, in December from November.

Categories
analytics

Local Market Best Since ’06’

A great article below from The Boston Globe’s Jennifer McKim. 
  • The Boston Globe
  • By Jenifer B. McKim

The Massachusetts housing market made a comeback last year, with 46,887 single-family homes sold — the best showing since 2006!

Single-family home sales statewide rose by 18.4 percent in 2012 compared with 2011,according to Warren Group, a private company that tracks real estate. Prices also rose, with the median price, or midpoint price, climbing a modest 1.8 percent compared with 2011, to $290,000.The new data seem to confirm what housing specialists have been saying for months — that the Massachusetts and US housing markets have turned a corner. The state’s single-family housing market hit a price peak in 2005 — at $355,000 — before dropping about 20 percent by 2009, Warren Group said. Home values have fluctuated, but now appear to be strengthening steadily, especially in the Boston area.This year “is going to be the base the housing recovery is built on,’’ said Alex Coon, a Boston market manager for the online brokerage firm Redfin.The state’s condominium market also is improving, with sales rising more than 25 percent in 2012 compared with the previous year, marking the highest number of condo sales in Massachusetts since 2008,according to Warren Group. The median condo sale price rose $277,000 in 2012, up 2.6 percent from 2011.The annual data were given a boost by brisk activity in December. Single-family home sales jumped by 8 percent compared with December 2011. Median home values rose to $300,000, a 12.3 percent increase compared with the same time in 2011, according to Warren Group.Condo sales also increased by 5.4 percent in December, compared with December 2011. The median condo sale price increased to $275,000 last month, 8 percent higher than during the previous December.

“It is clear we have turned the corner and are gaining ground rapidly,’’ said Timothy M. Warren Jr., chief executive of Warren Group.

Greater Boston showed even better numbers in 2012, with the median price for singlefamily homes hitting $470,000, 6.8 higher than in 2011, the Greater Boston Association of Realtors said. The group includes communities largely within the Interstate 495 loop. Condo prices in that region rose to $380,000, a 10.3 percent increase compared with 2011.

But as more buyers compete for homes, the number of properties on the market continues to shrink.

The inventory of single-family homes fell by 28.1 percent at the end of December, compared with 2011, according to the Massachusetts Association of Realtors, which also released data Thursday.

The number of condos for sale fell by 34.3 percent in December, compared with 2011, the association said.

John Ranco, senior associate at Hammond Residential Real Estate in Boston’s South End, said the lack of homes to sell is proving a challenge to the market’s recovery.

“We seem to have lots and lots of people looking for housing and very, very little to choose from,’’ he said. “It’s a little bit of a horse race to get properties into agreement right now.”

Christopher Doherty, president of the Northeast Association of Realtors, said he hopes more people start to realize now is a good time to put their homes on the market. “Buyers are out looking now, and every property that comes to the market is getting tremendous attention,” he said.

Categories
architecture general info

Changes In The Old Neighborhood

Interesting story on southendpatch.com regarding the wonderful wooden house on Taylor Street in the South End right off of Dwight Street . Hopefully things will work out to everyones satisfaction as it is a very special property and one which many south-enders are so familiar with.

Neighbors on Taylor St. House Demolition: Conditions Were Unsafe

The original stop work order put on the 8-10 Taylor Street wooden house property was because of environmental and project concerns, neighbors say. Now, it’s related to an entirely different issue.

Imagine sitting in your home one morning and feeling the entire floor shake. That’s how Taylor Street resident Louane Hann was notified of the construction happening on her street last Tuesday.

“I was working from home, and all of a sudden, I felt the earth move,” she said. “There was a guy with a backhoe and a guy with a hose, and they were ripping the house down.”

Hann said neither she nor anyone else in the neighborhood was notified that construction would begin at the wooden house at 8-10 Taylor Street, and that it would involve demolition of the building.

“We get notices about someone getting a roof deck you can’t even see half the time, and no one got a notice about this,” she said. “It’s unbelievable.”

Couple the lack of notice with the complete surprise that the building, which neighbors thought had been approved for a renovation and addition, was being completely demolished. And the day of demolition left dust everywhere, debris on neighbors’ porches and properties, and even broke a window at a home next door, said nearby residents.

“During the demolition I saw two kids standing outside watching, and I remember thinking, ‘Is it safe for those kids to be breathing that?” Hann said. “All of these old homes have lead in the paint,” she said.

Neighbors said they called Boston’s Enviornmental Department to complain about the mess and to voice the worry that the old home contained lead paint that was now swirling through the air on their street.

Through those calls to the city, the Landmarks Commission learned that an extra wall on the property was demolished that was not included in the project’s original plans, the home’s east wall.

A stop work order was posted on Friday, Jan. 25th and the owner was asked to appear at a public meeting of the Landmarks Commission on Tuesday.

By Monday, Jan. 28th, the project’s architect Scott Slarsky said the city’s Inspectional Services team had come through the site and determined there was no asbestos or lead paint, and lifted the stop work order due to the environmental concerns. But that still left a stop work order related to the site’s demolition of the property’s east wall.

Property owner Ramy Rizkalla said contractors and inspectors found the east wall was bowing in, it was rotting, and there was termite damage, and a structural engineer ruled the wall was unsafe to leave on the property. Rizkalla said the decision to take down the wall was approved by the city’s Inspectional Services department. However, it is the Landmarks Commission that requested the hearing on Tuesday.

“Though they aren’t going to comment on the design of the east wall, they did want to review the rebuilding, so that’s what we’re going in for on Tuesday,” Rizkalla said.

So for now, the project is still on hold until Tuesday night’s meeting of the South End Landmarks Commision. The meeting will take place at 6:45 at Boston City Hall, room 801.

But for neighbor Hann and other neighbors who feel like they were fed some kind of bait and switch between the plans that were presented to them and the actual demolition, the damage is already done.

“We’ve lived there about 20 years and really value that house as one of two remaining wooden houses in the South End,” said Hann, who wasn’t in favor of the orignal plans to begin with because she felt certain modern elements in the design didn’t fit in with the neighborhood. The demolition of the extra wall adds insult to injury, she said, calling it “obnoxious and insulting.”

“Now it’s really heartbreaking to look at that house,” she said.

Categories
analytics

Goode & Farmer Report Boston – January 2013

Lack of Inventory remains the challenge.

The Big Number is 23%. Combined, all Boston neighborhoods saw a 23% increase in the number of condo sold in 2012, from 3,544 sales in 2011 to 4,361 sales in 2012. The average sales price of condominiums increased 5% to $563K from $536K in 2011. The median sales price increased 8% to $410K from $380K in 2011. This real estate market is healthy except for the continuing decrease in inventory levels. The number of condominiums for sale in downtown has dropped 46% to 565 from 1050 last year at this time, and that was an extremely low number!

The Back Bay, saw a 24% increase in sales to 537 units from 433 in 2011, while the average price of a condo sold increased by 5% to $1.18M. The number of condos available for sale dropped 49% from 158 last year to only 80 today.

The South End saw a 9% increase in the number of condo sales to 540 condos sold year to date compared to 497 last year. The average price of a condo sold increased 6% to $704K compared with $663K last year. The inventory of condos for sale decreased 30% from a very low 91 last year to a terrifying 64 today. The dearth of inventory is the issue going forward.

South Boston saw a 26% increase in the number of condo sold to 585 in 2012 compared with 466 in 2011. The average sales price of a condo increased by 11% to $423K compared with $382K in 2011. South Boston has the largest drop in inventory of all downtown n’hoods down 72% from 141 properties for sale on this date last year compared to 39  available for sale today.

Inventory remains the problem, but as I have said repeatedly this market is so resilient and so desirable that declining inventory levels have not negatively effected the steady increase in sales and prices. Time will tell if this dynamic continues.