Categories
general info

Boston Prices Soar

Interesting fact from Trulia that Scott reported on Boston.com

Boston proces soar while the suburbs lag.

Posted by Scott Van Voorhis, Boston.com

Home and condo prices in Greater Boston’s suburbs rose a solid 6.1 percent over the first five months of 2013 compared to the same period in 2012, real estate portal Trulia reports.

But Boston home and condo prices blew that number away, rising 10.1 percent during the same period.

While price increases in the cities are outpacing the suburbs around the country, Boston is in a league of its own, right along with New York, where prices are also on a tear.

“The difference makes it among the biggest gaps in the country,” Jed Kolko, Trulia’s chief economist, commented in an email.

Yet despite or maybe because of the rising city prices, the suburbs are seeing markedly faster population growth.

While urban areas saw their overall population rise by .36 percent, the suburbs grew much faster, by .56 percent, Trulia reports.

Leading the upward charge in prices are “high-rise neighborhoods,” as well as ethnically diverse neighborhood and zip codes with a significant percentage of same sex couples.

Needless to say, such diversity is for the most part the monopoly of urban areas right now – a pattern particularly evident in Greater Boston. Our suburbs, for the most part, are the opposite of diverse.

Neighborhoods where no particular ethnic or racial group makes up the majority saw prices rise 14.3 percent. And in neighborhoods where same-sex couples account for more than 1 percent, prices rose a staggering 16.5 percent.

It does make you wonder whether the cities and suburbs are getting ready to change places now, with rising urban prices pushing anyone who can’t afford elevated prices and rents into the suburbs.


Categories
general info

Inventory Shortage Eases

Good national perspective on inventory levels from Teke at realtor.com.

Inventory shortages ease

Realtor.com data shows 4.3 percent growth in listings from May to June
Teke Wiggin

Teke Wiggin Staff Writer

Inventory shortages that constrained home sales this spring are beginning to ease, with the number of homes listed for sale trending upwards in June, according to realtor.com data, The Wall Street Journal reports.

The total number of listings rose by 4.3 percent from May to June, to 1.9 million homes. While that’s down by 7.3 percent from the same time a year ago, inventory was off 18.6 percent year over year in February, the newspaper said.

Real estate industry observers have speculated that home price gains might spur more homeowners to put their properties up for sale — and for builders to break ground on more new homes.

With the latest CoreLogic Home Price index showing a 12.2 percent year-over-year gain in home prices in May, the recent uptick in listings — though bolstered by a normal seasonal increase — suggests that these market reactions may be starting to play out.

“No one wants to sell at the bottom, but prices have now been rising for more than a year and by more than 30 percent in some markets — triggering some homeowners to lock in those gains, including those who have been underwater,” said Jed Kolko, chief economist at listing portal Trulia.

But while home value appreciation may be coaxing some to sell, National Association of Realtors Chief Economist Lawrence Yun said in a statement last month that growth in home supply will primarily depend on an increase in construction.

“The housing numbers are overwhelmingly positive,” Yun said about May home sales, which NAR said hit their highest level since November 2009. “However, the number of available homes is unlikely to grow, despite a nice gain in May, unless new home construction ramps up quickly by an additional 50 percent. The home price growth is too fast, and only additional supply from new homebuilding can moderate future price growth.”

A recovery in construction activity is already beginning to take hold, Kolko noted.

“Even though inventory peaks in the summer and drops off later in the year, buyers should have more to choose from next spring and summer than they had this year,” he said.

Categories
analytics

Tight Inventories Effect Growth Prospects.

The Inman News article below provides interesting national context to the extreme lack of inventory in our local markets.

NAR: Pending sales dip from November to December

BY INMAN NEWS

Inman News®

Tight listing inventories are likely to constrain growth in 2013 home sales, the National Association of Realtors said in releasing a report showing that pending sales dropped 4.3 percent from November to December.

Despite the month-to-month drop, existing homes under contract were up 6.9 percent from a year ago, making December the 20th month in a row to see an annual gain in pending sales.

NAR’s Pending Home Sales Index, which represents existing-home contracts signed but not yet closed, rose to 106.3 in November before slipping to 101.7 last month. In April 2010, when the federal homebuyer tax credit was still in place, the index hit 111.3, but soon dipped back down.

An index score of 100 is equal to the average level of sales contract activity in 2001, the first year examined by the trade group and a year in which home sales fell in what’s considered a normal range for the current U.S. population. Contracts signed in a month typically close one or two months later.

Although NAR is projecting that home sales will pick up by 9 percent in 2013, tight inventory, paired with near-record low new-home construction levels, is an obstacle to more rapid growth.

The month-to-month dip in the pending sales is not a “statistical fluke,” Yun said, but signals a loss of momentum in home sales. The momentum, however, is inventory-related, he said — demand is still high.

New homes, Yun said, are the solution to the inventory challenge. “True relief to the inventory has to come from new home construction.”

Regionally, the West, with extremely tight inventory, was the only region to see a decrease in pending home sales in December from a year ago with a 5.3 percent drop.

December 2012 year-over-year change in pending sales of existing homes index by region

Source: National Association of Realtors

The Midwest, South and Northeast had year-over-year index increases of 14.4 percent, 10.1 percent and 8.4 percent, respectively, in December.

On a monthly basis, only Midwest’s index increased in December — 0.9 percent. The pending existing-home sales index fell in the West, Northeast and South from November to December 8.2 percent, 5.4 percent and 4.5 percent, respectively, in December from November.

Categories
analytics

NAR Report Prices Rise In Q3

Below is a great Agent Genius post putting perspective on the national real estate market.

by  in EconomyNews – Agent Genius 

 New data shows strength of prices rising

According to the latest quarterly report by the National Association of Realtors, growth in metropolitan area median home prices increased in the third quarter, and more areas are showing gains. The median existing single-family home price rose in 120 out of 149 metropolitan statistical areas (MSAs) based on closings in the third quarter compared with same quarter in 2011, while 29 areas had price declines, up from 110 areas with annual improvement in the second quarter. In the third quarter of 2011, only 39 metros improved, marking stronger home increases.

Dr. Lawrence Yun, NAR’s Chief Economist, said in a statement, “Housing inventories have been gradually trending down from a record set in the summer of 2007,” he said. “Earlier this year, a broad equilibrium began to develop in most areas between home buyers and sellers, which led to a sustained upturn in home prices. We expect fairly normal appreciation patterns in 2013, but there is a risk of price acceleration if builders are unable to increase supply to meet the needs of our growing population and household formation.”

The national median existing single-family home price was $186,100 in the third quarter, up 7.6 percent from $173,000 in the third quarter of 2011, which is the strongest year-over-year price increase since the first quarter of 2006 when the median price rose 9.4 percent. In the second quarter the price increased 7.2 percent from a year earlier.

The median price is where half of the homes sold for more and half sold for less; medians are more typical than average prices, which are skewed higher by a relatively small share of upper-end transactions.

Some of the price gain resulted from a smaller share of distressed home sales in the market, but the higher prices significantly reflect a market recovery. Distressed homes accounted for 23 percent of second quarter sales, down from 30 percent a year ago.

A separate breakout of income requirements to buy a home on a metro area basis shows buyers in the vast majority of areas had ample income in the third quarter, assuming they could meet stringent mortgage credit standards.

Total existing home sales rose 3.2 percent

Total existing-home sales rose 3.2 percent to 4.68 million in the third quarter from 4.54 million in the second quarter, and were 10.3 percent higher than the 4.25 million pace during the third quarter of 2011. At the end of the third quarter, 2.32 million existing homes were available for sale, which is 20.0 percent below the close of the third quarter of 2011 when 2.90 million homes were on the market.

According to Freddie Mac, the national commitment rate on a 30-year conventional fixed-rate mortgage averaged a record low 3.54 percent in the third quarter, down from 3.80 percent in the second quarter and 4.31 percent in the third quarter of 2011.

NAR President Moe Veissi said affordability conditions are a big factor in rising sales. “Historically low mortgage interest rates are encouraging many buyers who were on the sidelines,” he said. “Sales this year are notably higher than the levels seen in 2008 through 2011, so we’re clearly in a recovery phase with rising sales, declining inventory and rising prices. Of course the recovery would be stronger and more stable if we could return to safe but sensible mortgage underwriting standards.”

First time buyers.

First-time buyers purchased 32 percent of all homes in the third quarter, down from 34 percent in the second quarter; they were 32 percent in the third quarter of 2011.

The share of all-cash home purchases was 27 percent in the third quarter, down from 29 percent in the second quarter and 29 percent in the third quarter of 2011. Investors, who make up the bulk of cash purchasers and compete with first-time buyers, accounted for 17 percent of all transactions in the third quarter, down from 19 percent in the second quarter and 20 percent a year ago.

“The modest decline in first-time buyers and investors shows the impact of limited inventory in the lower price ranges from a shrinking share of distressed homes, which are popular with both of these groups,” Yun explained.

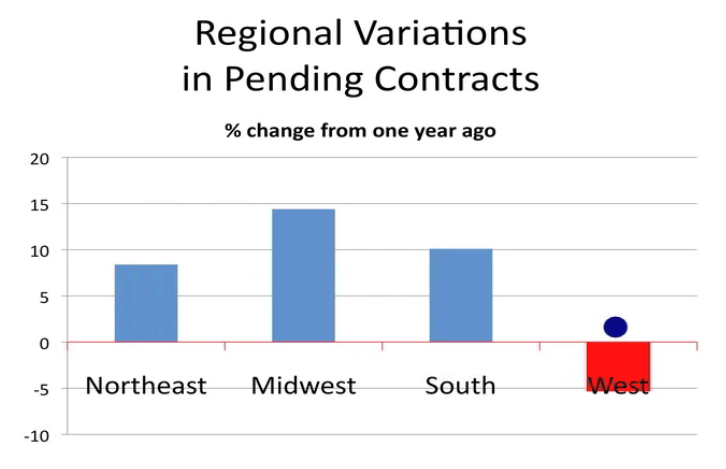
Regional performance varied

Regionally, existing-home sales in the Northeast increased 1.7 percent in the third quarter and are 9.8 percent above the third quarter of 2011. The median existing single-family home price in the Northeast slipped 0.3 percent to $246,900 in the third quarter from a year ago.

In the Midwest, existing-home sales rose 5.2 percent in the third quarter and are 17.8 percent higher than a year ago. The median existing single-family home price in the Midwest increased 4.2 percent to $151,100 in the third quarter from the same quarter in 2011.

Existing-home sales in the South increased 5.4 percent in the third quarter and are 11.7 percent above the third quarter of 2011. The regional median existing single-family home price rose 5.7 percent to $165,400 in the third quarter from a year earlier.

In the West, existing-home sales slipped 1.2 percent in the third quarter due to limited supplies, but are 2.1 percent higher than a year ago. With the tight inventory, the median existing single-family home price in the West surged 20.2 percent to $247,400 in the third quarter from the third quarter of 2011.

Categories
architecture general info

44th Annual South End House Tour

Get a Glimpse Inside the South End’s Coolest Homes on the South End House Tour

This year’s South End House Tour will take place on Saturday, Oct. 20.

by Sara Jacobi…South End Patch

It’s a little bit like the History Channel meets HGTV. Right in your backyard.

Get a peek into several of the South End’s historically notable or highly designed homes on the 44th annual South End House Tour, put on by the South End Historical Society.

The tour, to be held on Saturday, Oct. 20 from 10 a.m. to 5 p.m., is a self-guided walk through six amazing South End homes starting at the Southwest Corridor and ending mid-way down Shawmut Avenue. Since the tour is at-your-own-pace and snakes around on a more than 1 mile path, the full tour can take anywhere from two to four hours. It starts at the Boston Center for the Arts.

South End Historical Society Executive Director Hope Shannon said the idea for the house tour began more than four decades ago as a way to showcase the creativity and history of the neighborhood.

“People were buying a lot of run down or abandoned buildings in the South End and restoring them,” she said. “The neighborhood was much different back then.”

Today, the tour seeks to showcase all sorts of notable homes, from the historical, to the “green,” to the homes with unique architecture or high design.

Special to the 2012 tour is a combination deal with the Ellis Memorial Antique Show, which will be held at the Cyclorama on the same day. A ticket to the house tour comes with a complimentary admission to the antiques show. This year’s tour will also feature a stop inside the New Hope Baptist Church, which will soon be turned into condo apartments.

Shannon said that besides serving as a significant fundraiser for the historical society, the house tour’s main goals are to continue bringing people into the South End and to showcase the neighborhood’s history and charm.

“The neighborhood has changed so much, and the homes have so much history,” she said. “We want to remind people of the long history and bring awareness for continued preservation. We want visitors to leave with positive memories of the people they meet and the businesses they patronize, and recognize the South End is an important place historically.”

Tickets are on sale now through Oct. 19 for $25, and can be purchased online at the Historical Society’s website or through several different realtors in the neighborhood. Tickets will also be on sale on the day-of for $30 each. A $50 ticket includes admission to a private party at an additional house. 

Related Topics: south end historical society and south end house tour

Categories
analytics general info

Boston Q3 Condo Sales Review

The Big Number is 21%. That’s the increase in condo sales year over year at the end of the 3rd quarter, September 30. Combined, all Boston neighborhoods saw a 21% increase in the number of condo sales year to date, a 3% increase in the average price of a condominium sold to $545K, and an 8% increase in the median sales price to $409K. This real estate market is healthy except for the continuing decrease in inventory levels. Inventory levels of available condo’s for sale have fallen 41% to 919 properties for sale versus 1,567 at this time last year.

The Back Bay,  saw a 20% increase in sales year to date, but the average price  of a condo sold dropped by 2% to $1.120M. The inventory level of condos for sale dropped 53% to 95 condos for sale vs 204 last year.

The South End saw a 13% increase in the number of condo sales to 425 condos sold year to date compared to 377 last year.  The average price of a condo sold increased 4% to $690K compared with $665K last year. The inventory of condos for sale decreased 52% from 173 last year to 83 today. This will continue to be a factor in market performance going forward.

South Boston saw a 28% increase in the number of condo sales year to date compared with 360 last year. The average sales price of a condo increased by 9% to $421K compared with $388K last year.  South Boston has the largest drop in inventory of all downtown n’hoods down 60% from 196 properties for sale last year to 78 available for sale today.

Inventory remains the problem, but as I have said repeatedly this market is so resilient and so desirable that declining inventory levels have not negatively effected the steady increase in sales and prices. Go figure!


Categories
analytics general info

Lack of Inventory In Boston Getting Serious

My good friend, excellent agent and blogger Briggs Johnson at Coldwell Banker Residential Brokerage hits it squarely on the mark with this post which illustrates the decrease in inventory year over year and its potential effect on the market. I have posted it in its entirety below. Visit his blog. 

September 18, 2012 By 

“The Caravan Indicator”

There are several indicators and indexes that people follow to determine market conditions.  The indicator I am going to use that sparked this blog entry is  going to called the “Caravan Indicator”. What many people don’t know is that behind the scenes here at Coldwell Banker (downtown), every few weeks, we hire a bus to drive us all around town to check out new listings in Back Bay, Beacon Hill, South End, South Boston and the Seaport District etc. Its a great way for us to view new inventory and for us to be knowledgeable of the market in all price points. Today, is caravan day and it was cancelled due to lack of inventory…..Wait, What?! I can understand there being a cancelled caravan in late fall or August when everyone is on vacation, but not now, not September, not in the second week of the second strongest time of year to get new inventory. Really?

I was ready to bounce around the city and view some properties, but, since that wasn’t happening, I did some research to see how limited inventory really is. I went on MLS and looked up current inventory, the amount of listings currently under agreement and the amount of listings that have been sold in the past 2 months. The numbers don’t lie and I found them pretty shocking. Since I really only focus on the downtown neighborhoods. I used the 4 neighborhoods i do a lot of business in . Here are the Stats:

Neighborhood         # of Listings    # Under Agreement      # Sold in last 2 months

Back Bay                            104                                  57                                   124

South End                          78                                   57                                    110

Beacon Hill                        59                                  14                                      41

Seaport District               16                                  7                                        23


Last Year (2011)              # of Listings                          % Decrease from 2011

Back Bay                                213                                                           52%

South End                             183                                                           58%

Beacon Hill                            82                                                             28%

Seaport District                   37                                                             57%


The way I look at this information is that it is a great time to sell and list a property. There are a ton of buyers out there and they are in desperate need of decent inventory. On the flip side, If you are a buyer looking in these neighborhoods, be prepared to be frustrated and be ready to enter a multiple offer situation (if you are a serious buyer looking in a popular area). In the South End alone there have been 24 places go under agreement in the past 2 weeks.  If you are a buyer looking in the South End under $450k. there are only 9 places on the market and only 3 of them are north of Washington Street. If you are a buyer looking in the 800-1 million range in the Back Bay, there are only 11 listings on the market.  Six of those listings have been on the market for over 100 days, so quality is as compromised as quantity right now. If you are a Beacon Hill buyer looking from 600-900k there are only 3 listings on the market. 2 of those listings have been on the market for over 170 days. Brutal!!

I can understand that sellers are hesitant to list because there  isn’t much to move into if they sell and want to stay in downtown Boston. But if you are a possible seller looking to move out of state or to the “burbs” this could be an ideal time to make the jump.

I know all downtown agents are saying “list your property now” but hopefully some of this data, makes you think about the scenario with a different tone. Have hope and don’t be afraid to enter the market, just be informed and realistic.

Happy Hunting and Start Listing!!


Categories
analytics general info

Boston Condo Prices Set Record… And A Scarcity Of Units Ensues!

Yesterdays Boston Globe article follows for those who didn’t see it. It is all the buzz!… and for good reason.

Globe Staff / July 24, 2012
Condominium values in Boston’s core reached a record high during the second quarter of this year as eager buyers drove up sales, according to data­ scheduled to be released Tuesday.
The median price in a dozen downtown neighborhoods — they include Beacon Hill, the Fenway, the North End, and South Boston — climbed to $515,000 during the three months that ended June 30, according to LINK, meaning half sold for more than that price and half for less. That topped the previous peak of $498,500 in 2008, just prior to the nation’s financial crisis. LINK, a Boston company, tracks the downtown condominium market.
The increase adds to mounting evidence that the state’s housing market is on the mend, housing specialists said.

The feeling out there is prices are not going to soften anymore,” said Barry ­Bluestone, the director of the Dukakis Center for Urban and Regional Policy at Northeastern University. “We are seeing the real signs of a recovery in the housing market.”

Even during the worst years of the real estate industry’s decline, condominium prices in some of Boston’s more desirable areas fell only modestly, putting the local market in a better position to rebound. Prices and sales were propped up by higher-income homeowners who were hurt less during the recession, as well as by the increasing popularity of urban living coupled with limited inventory, housing specialists said.

“The city attracts young and old by providing fun and beauty, art and restaurants, all without needing a car,” said a Harvard University economist, Edward­ Glaeser, author of the book “Triumph of the City.”

Trisha Collins McCarthy, president of the Massachusetts Association of Realtors, said many condominium buyers like the idea of trading long, congested commutes for city conveniences. “We have more of a population that has said, ‘I want to be near the train,’ ’’ she said.

After dropping for a couple of years, downtown condo prices started to climb in 2010. This year, that growth has been bolstered by continued low interest rates and improving consumer confidence, according to housing specialists.

Condominium sales volume was up sharply during the second quarter of this year, to 1,051, or nearly 36 percent more than during the same three months of last year.

The median sale price of condominiums in luxury buildings — those that offer amenities such as concierge and valet services — also climbed.

The $779,000 median closing price for the luxury condos was 7.8 percent higher than during the second quarter of 2011, LINK said, compared with 7.5 percent higher for the all of the Boston neighborhoods measured by the company.

The number of luxury condo sales during the past three months increased by 22.2 percent to 198, the company said.

Statewide, single-family home values remained essentially flat in June, at $331,000, compared with June 2011, while the number of sales increased by 18 percent to 5,099, according to William Raveis Real Estate, Mortgage & Insurance. It is based in Shelton, Conn., but also does business in Massachusetts.

Even though more people are signaling they are ready to buy a condominium in Boston, real estate agents say they struggle to find enough units to show. Only 531 properties were available in the downtown area on the last day of June, about half the number up for sale on that day in 2011, LINK reported.

Eddy Foley, 45, said he has spent six months looking for a South End condominium priced in the $500,000 range. He found one he wanted, but lost out when someone else bid $34,000 over the asking price.

“It’s torture out there,” Foley said. “There’s really nothing available.”

Carmela Laurella, president of the Boston-based real estate company CL Waterfront Properties LLC, said condominiums priced reasonably are selling quickly.

Indeed, sales on the Boston waterfront jumped by 72.7 percent in the second quarter, compared with the second quarter of 2011. The median price for a waterfront condominium increased by 21.2 percent, to $827,000, LINK found.

“We have more demand than we have property to sell,’’ Laurella said. “We can barely list anything without it going under [a purchase agreement] within a couple of weeks.”

John Ranco, a senior sales associate with Hammond Residential Real Estate in the South End, said times have changed so drastically that real estate agents are now searching to locate interested sellers rather than wary buyers.

“The supply side is really hurting,” Ranco said. “There is a tremendous amount of pent-up demand.”

Jenifer B. McKim can be reached at [email protected]

Categories
analytics

We All Knew It – Home Sales Are Back

The comeback in home sales that many of us have been seeing hints of is now backed up with solid numbers. All reports are showing sales increases as well as declining inventory levels. Second quarter sales reports will show terrific numbers especially in downtown Boston neighborhoods. Sales of single-family homes in Massachusetts have bounced back to levels not seen since the Great Recession sent an already declining market into a tailspin. The Massachusetts Association of Realtors reported this week that May home sales were up more than 27 percent over the same month last year, while  The Warren Group pegs the jump at 35 percent.

The best news is that after hints of recovery for months, and most importantly our experience on the streets, the long-suffering real estate market finally appears to be living up to expectations and is finally in a recovery and coming out of the the deep trough it plunged into after the near global economic collapse of September 2008.

The 4,445 homes sold in May surpassed both May 2007 and May 2006 as well, when 3,884 and 4,200 homes were sold, respectively, in those months, according to a comparison of numbers from past monthly reports on the MAR website.

Look for articles and reports touting these terrific results and for the resulting positive effect on buyer and seller confidence.

Categories
analytics

Boston Condo Inventory Down 32%

The supply and demand dynamic is firmly in place in downtown neighborhoods with not enough property for sale relative to buyer demand. Taking all Boston neighborhoods together, condominium inventory is down 32% from the same time last year – from 2,010 properties for sale last year to 1,360 today. In the South End there are 129 condos for sale versus 205 on the market last year at this time,  a 37% decrease.

Linda Ciborowski, a top South End agent with Coldwell Banker Residential Brokerage, sees two very interesting developments as a result of these depressed inventory levels.  Linda says, “Anything that shows well, is in good condition and in a desirable location sells with amazing speed. I’ve noticed two interesting things that make it even more important to be working with a good broker.”

“Brokers who don’t know the market are pricing properties too low based on old comps or too high based on false expectations. Initial pricing just seems more important than ever.”

 “Appraisals have become very difficult since the properties that have closed in the past 6 months don’t reflect the prices that new listings are going under agreement for due to prices being driven up by low inventory.”

In the Back Bay today there are 171 condos on the market compared with 240 last year. That’s a 29% decrease. In South Boston 145 condos are listed for sale compared with 232 last year, a 37% decrease. Reports are that there are not a lot of listings in the pipeline. Hopefully, we will see a surge in listing activity through the end of April and into May.

This low level of inventory poses a few issues for the strengthening real estate market downtown. The first being that inventory is needed to sustain the strong beginning to the spring market. The second is that high demand and low inventory creates what some may consider “irrational exuberance.” I don’t believe it is irrational. These conditions “on the street” have created this excitement… and the excitement is real!  Just ask any buyer who has missed out on a property or talk to any agent who has dealt with 40 people at each of their Sunday open house. It is exciting… and we will keep our eye on the market as we move into May.