I am reposting this Lovejoy Wharf story from Curbed.com and Tom Acitelli because it is so exciting to see it finally happening. I worked on this project pre-development at Coldwell Banker Residential Brokerage oh so many years ago. So happy to see the incredible Barbara Cusack named sales director for this Related Beal development.
Tag: Boston condo market
Boston Sales And Prices Jump
A good year end analysis from Scott at Boston.com.
Boston sees condo prices, sales jump

From Back Bay and Beacon Hill to Dorchester and Southie, doube-digit price increases have been seen in several Boston neighborhoods.
Boston’s red hot condo market is closing out the year with a bang, posting double-digit increases in prices and sales, the latest stats show.
The median condo price in Suffolk County, made up mostly of Boston, hit $580,000 in November after a 34 percent jump, finds real estate publisher and data firm, The Warren Group. Condo sales jumped 43 percent.
By contrast, the median home price in Boston and fellow Suffolk County communities of Chelsea, Winthrop and Revere, weighed in at $406,500 after a 3 percent increase.
Downtown Boston, including the South End, Back Bay, and Beacon Hill, led the condo price charge, with a 24 percent increase that pushed the median price to $974,000.
Jamaica Plain and South Boston both saw significant gains in condo prices in November, with prices year to date up nearly 11 percent ($445,000) in J.P. and 12 percent ($557,000) in Southie.
Dorchester and East Boston, which have been hubs of activity for new development as buyers get priced out of other neighborhoods like J.P. and the South End, also saw big gains.
Year-to-date through November, Dorchester’s median condo price has gone up 17 percent, to $344,060, while the median price of an Eastie condo rose 14 percent to $342,750.
Meanwhile, statewide, sales and prices of both condos and homes posted gains in November, posting significant gains with help from a relatively mild fall that helped keep buyers on the hunt and sellers in the game.
Sales of single-family homes across Massachusetts rose 8 percent, to 3,915 in November, reports the Massachusetts Association of Realtors (MAR).
The state’s median home price rose 4.5 percent to $330,000.
Condo sales rose 5 percent, while the median price of a condo posted a 10 percent increase, to $304,000.
“While most people in Massachusetts were focused on raking, getting ready for Thanksgiving and shopping in November, homebuyers stayed focused and once again push closed home sales up,” said 2015 MAR president Corinne Fitzgerald, broker-owner of FITZGERALD Real Estate in Greenfield, in a press release.
Banker & Tradesman – July is Best Month for Mass. Home Sales since 2005, Grow 24.3 Percent Year-Over-Year
BOSTON, August 25, 2015 – The 7,077 single-family home sales in July signaled the best month for the Massachusetts real estate market since June 2005, according to a new report from The Warren Group, publisher of Banker & Tradesman.
By breaking 7,000 sales, July saw the market’s first return to that level in more than 10 years, since the 7,239 sales recorded in June 2005. The big month marked a 24.31 percent increase year-over-year from July 2014, which had 5,693 sales.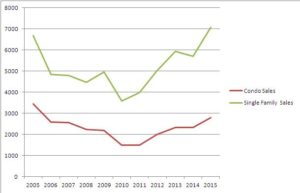
The median sales price for single-family homes in July 2015 was $359,900, a 1.38 percent increase from July 2014’s median of $355,000. Year to date the median price has been $340,000, a 1.49 percent increase from last year’s mark of $335,000 through July.
“July’s numbers are the result of a very strong spring season and are an improvement over the sluggish start to the year,” said Cassidy Murphy, editorial director of The Warren Group. “A rough winter and pent-up demand turned into a strong spring that is a positive sign for the real estate market throughout the state.”
The condo sales market in July was also robust, seeing 2,794 sales, the most since August 2007. This month’s mark was a 20.07 percent increase from July 2014, which had 2,327. July 2015 supplanted last month as the best month in the eight-year stretch. There were 2,764 in June.
The median condo price in July was $337,500, up 3.85 percent from July 2014, when the median was $325,000. Year to date the median condo price has is $316,685, up .86 percent from $314,000 at this time last year.
Year to date Massachusetts has had 28,745 single-family home sales, a 6.52 percent increase from last year’s total through July of 26,985. There have been 12,132 condo sales through July, a 1.8 percent increase over last year’s year-to-date total of 11,917.
The Warren Group has recorded and tracked real estate transactions since 1872. The fourth-generation family-owned company uses its long-time leadership in Boston real estate and banking information to produce specialized reports and printed publications, including Banker & Tradesman and The Commercial Record.
With more than 140 years as a local business leader, The Warren Group has developed relationships with a variety of industry leaders and trade groups, including bankers, mortgage brokers, credit unions and lawyers. Working together with our partners, The Warren Group organizes trade shows and industry events, including The Bank Summit, coming in October.
For more information about The Warren Group, visit www.thewarrengroup.com.
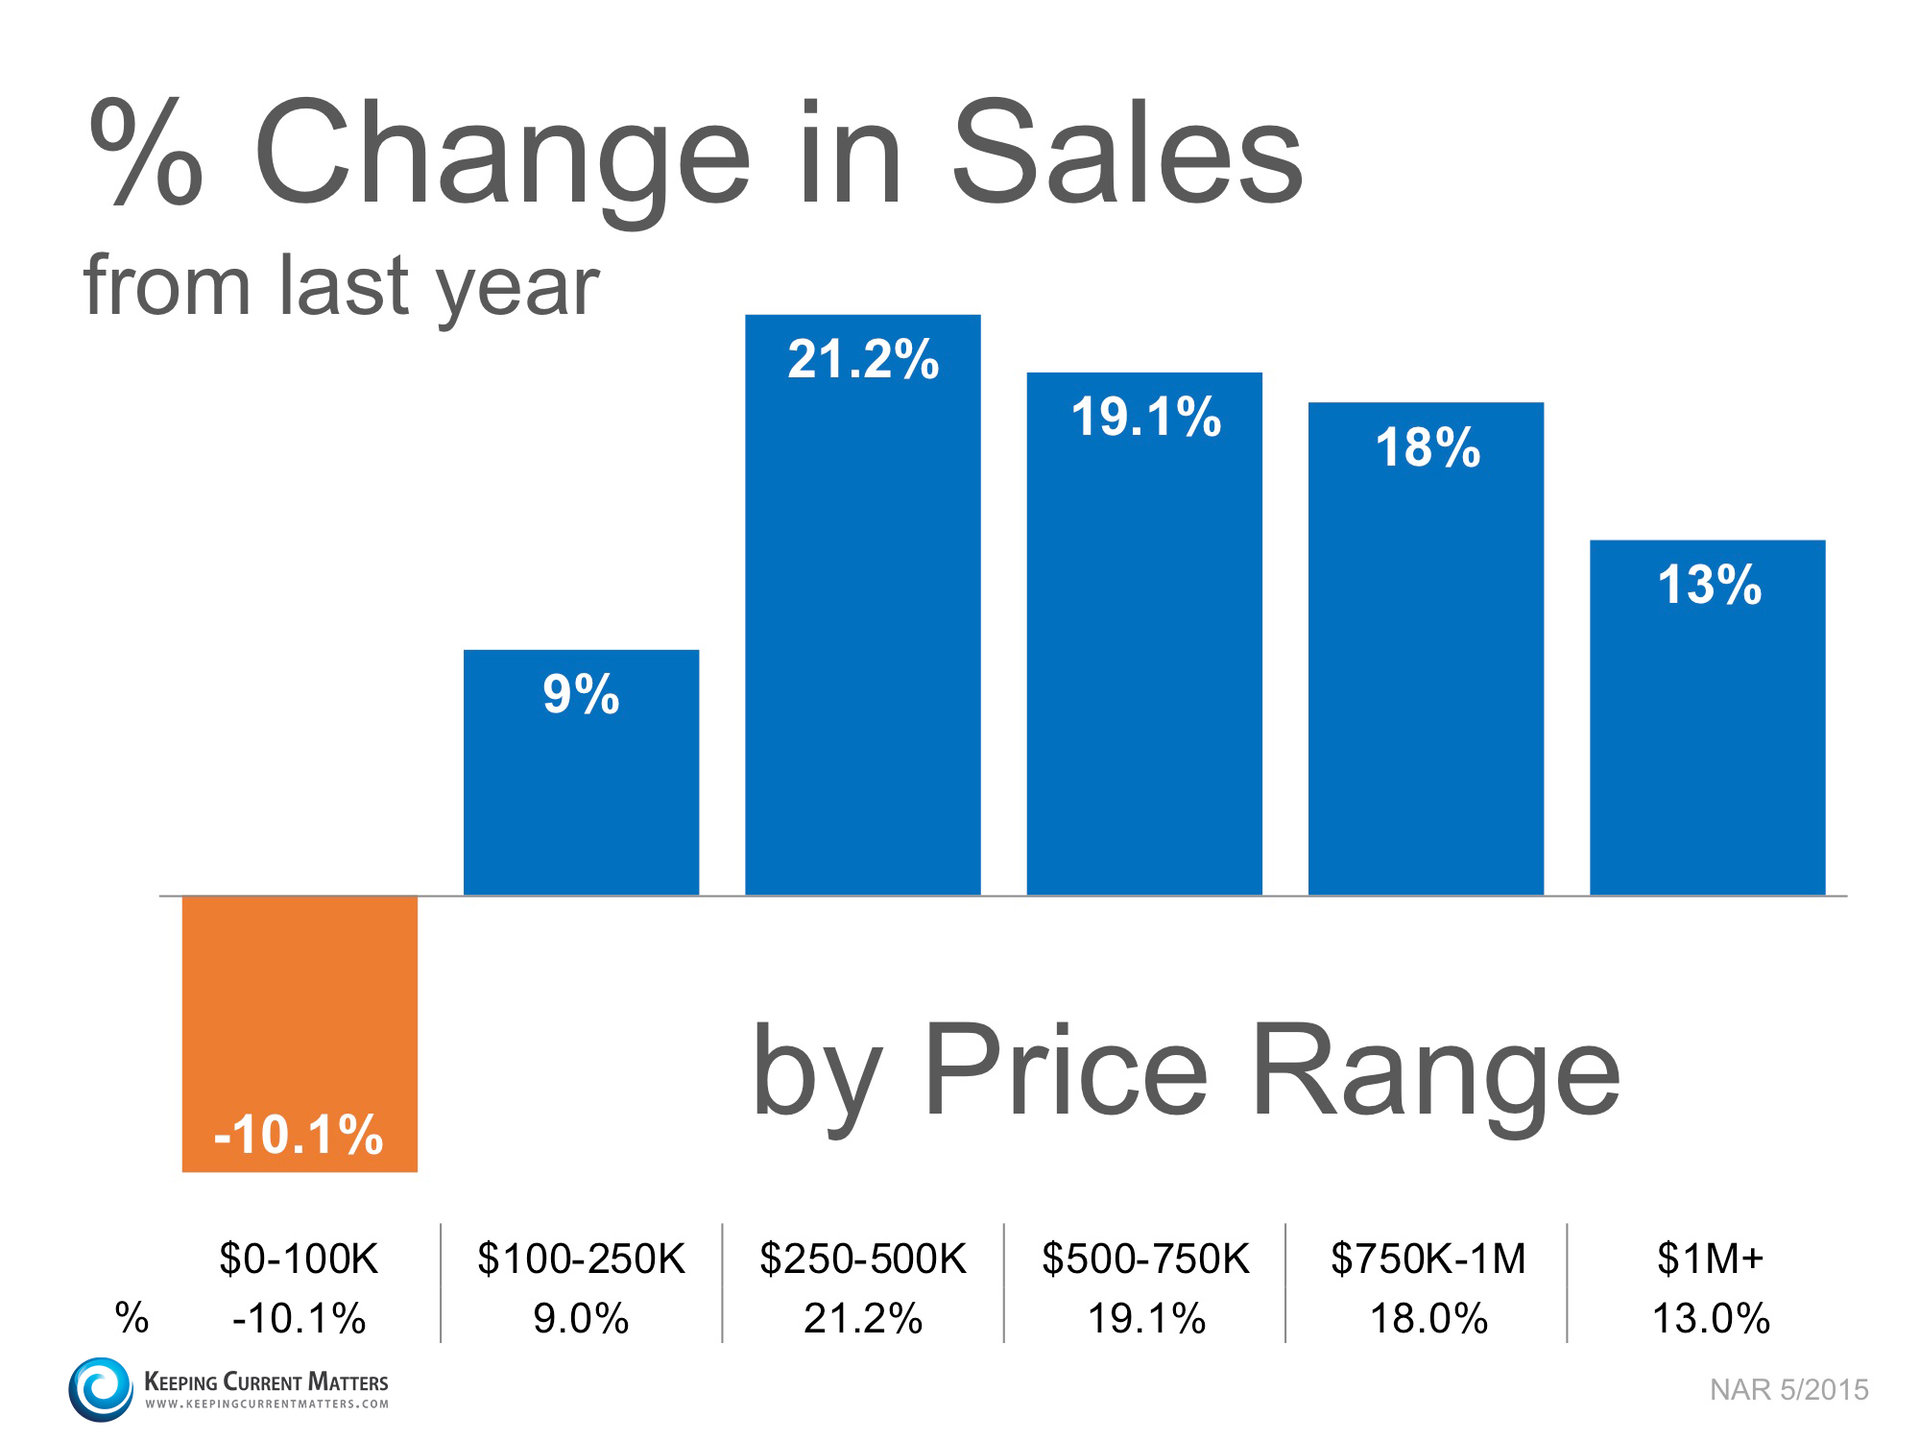
The KCM (Keeping Current Matters) crew is great at visuals. This one represents the general national trend toward rising prices
Sales Up In Almost Every Price Range

Here is the breakdown:
What does that mean to you if you are selling?
Houses are definitely selling. If your house has been on the market for any length of time and has not yet sold, perhaps it is time to sit with your agent and see if it is priced appropriately to compete in today’s market.
Why Prices Will Stay High
Good post by Scott about the effects of continued scarce inventory.
Why home prices are likely to stay high
Despite talk of the need for new housing, the number of building permits being issued across Massachusetts has yet to rebound to its pre-Great Recession peak.
Building permit slowdown
Developers took out just 1,051 building permits for single-family homes during the first three months of the year, U.S. Census Bureau stats show.
That represents a 16 percent drop from the same period in 2014 and a 65 percent drop from early 2006, when the real estate market was last in boom mode.
New apartment and condo construction is doing somewhat better. Developers took out permits for 2,370 new units, or roughly double the number of single-family homes, according to Census stats.
Yet the number of total housing units is still 33 percent below where it was back in the early months of 2006.
Tough regulations
And the shortage of listings on the market has been widely blamed for pushing up home and condo prices as demand exceeds supply.
“In theory, 2014 should have been better than 2013, but it wasn’t,” said Jeff Rhuda, director of business development at Symes, a home builder in the North Shore. “In theory, you have a recovering economy, but I think 2015 will end up below 2014.”
Tough regulations in towns and neighborhoods across the Boston area are one reason for the slow recovery in housing construction, especially as it relates to single-family homes, builders contend.
“It is going to get worse.” – Jeff Rhuda, director of business development at Symes
It is also especially hard to build new single-family homes within the Route 128 beltway, where the biotech and tech sectors are booming and demand for new homes is the strongest.
A dearth of developable land combined with local restrictions has resulted in a steady decline in home building in the communities closest to Boston.
In fact, teardowns are now the only source of new homes in upscale communities like Needham, Newton, Wellesley, and Weston.
And with no major game changer in the works in terms of efforts to force local communities to open their doors to more housing, the number of homes being built in the Boston area is likely to only continue to fall, Rhuda contends.
“It is going to get worse,” he said.
Interesting post by Scott.
Homes are getting more expensive all over Mass., but these towns have it worst
The cost of buying a house in Massachusetts, already one of the most expensive states in the nation, just keeps on going up.
The pattern continues
Bay State home prices rose again in April, and several Greater Boston suburbs posted some of the biggest gains.
The median price of a home in Massachusetts rose 3 percent from last year to $324,500, reports The Warren Group, which tracks home prices across the state.
Home sales fell 7.6 percent, but given that most of the initial purchase and sales agreements were inked in February amid record snowfall, with the final closings in April, the decline was likely a result of the extreme winter weather, said Timothy M. Warren Jr., The Warren Group’s chief executive.
“Prices, though, continue to rise, which tells us that the demand is there and the market is strong,” Timothy M. Warren Jr. of the Warren Group said. “Lack of inventory is the biggest problem.”
Overall, a combination of strong demand coupled with a shortage of homes for sale has helped drive prices up, experts say. Newly built starter homes are somewhat of a rarity inside Route 128, and home building numbers are down in general across the state.
“Prices, though, continue to rise which tells us that the demand is there and the market is strong,” Warren said. “Lack of inventory is the biggest problem.”
Some towns stand out
Home prices have risen across the state in the past 30 out of 31 months, according to the Massachusetts Association of Realtors, which issued its own report. And some communities with extreme price increases also saw big dips in the amount of homes for sale.
• Milton saw its median price rise 77 percent to $753,000. The number of homes for sale dropped by nearly 12 percent, according to MAR.
• Hingham saw its median price soar past $952,000. Meanwhile, homes for sale dropped 23 percent.
• Westwood saw a 42 percent increase, to $707,000, while the number of homes on the market lowered by 6 percent.
Arlington, Medfield, Framingham, Natick, Hopkinton, Needham, Lexington, Milford, Newton, North Andover, and Andover all saw price increases ranging from 12 to more than 30 percent. With a couple exceptions, most also saw the number of listings drop.
Peabody, Quincy, Rockport, and Concordsaw significant price increases as well in the 8 to 9 percent range, MAR notes.
Condo sales are more varied
Meanwhile, condo prices fell statewide by 4 percent from last year to $305,000, with sales declining by 12 percent, according to the Realtors group.
However, a number of Boston area communities bucked that trend to follow the familiar growing-prices/falling-inventory arc instead, MAR finds.
• Newton: median condo price jumped 28 percent to $675,000, while the units on the market fell by 33 percent.
• Arlington: 15 percent jump in median condo price to $472,000, coupled with a 23 percent drop in the number of properties on the market.
• Brookline: median condo price rose 14 percent to $672,000, while the number of units for sale dropped by a quarter.
• Boston: median condo price rose 11 percent to $519,000, while listings fell 15 percent.
Provincetown shares many of these same characteristics! Just saying.
Why You Should Stay in Boston for the Rest of Your Life
Forget retiring to Florida. Boston may be the place to settle down.
According to AARP’s “Livability Index,” Boston is the second most-livable large city in the United States, falling just behind San Francisco.
Though AARP makes it clear that the index can relate to people of all ages, there are specific applications for the elderly:
“Retired residents on fixed incomes need affordable places to live; those who don’t drive need other transportation options; and those with mobility challenges need accessible transportation and housing. No one wants to be forced to leave their community because of changing income or physical agility.”
And, on AARP’s list of the 10 most livable neighborhoods, Boston’s Downtown Crossing made the cut.
AARP elaborated upon Downtown Crossing’s score calling it, “A shopping district in transition to more mixed use with high-rise residences. Adjacent to Boston Common (and all of its recreational amenities), the theater district and the financial district. Stations for three main rail lines are nearby. Some streets are for pedestrians only.”
With AARP’s “livability index” you can type in an address, state, city, or zip code to get a score that is based on an assessment of seven categories: housing, neighborhood, transportation, environment, health, engagement, and opportunity.
Boston received a score of 65 out of 100 for livability, broken down into the seven categories below. Each score is out of 100.
Housing (80): 86.3 percent of the units in Boston are multi-family and there are 681 subsidized housing units per 10,000 people, which is way above the U.S. median of 124. AARP says that they measure units that are multi-family as elders whose spouses have passed away, single-parent families, childless couples, or people who choose to share housing with roommates may prefer this living situation. But Boston’s housing costs, ($1,455 average per month), which includes taxes, rent, mortgage fees, and utilities, falls significantly above the U.S. average ($999 per month).
Neighborhood (76): In this category Boston ranks above the national average in a slew of metrics: access to grocery stores and famers markets, access to parks, access to libraries, access to jobs by transit, access to jobs by auto, diversity of destinations, and activity density. However, the city’s crime rate is slightly higher than the national average.
Transportation (84): In regards to frequency of local transit service, walking trips, household transportation costs, and crash rates, Boston does better than the United States on average. Maybe not so shockingly, Boston does worse than average in terms of traffic congestion.
Environment (65): Boston ranks well in drinking water quality and air quality, boasting only two unhealthy air quality days per year, below the median U.S. average of eight days. But Boston does fall short in near-roadway pollution and local industrial pollution.
Health (65): 99.8 percent of people in Boston have access to exercise opportunities and 21.7 percent of people are obese, which is below the national average. Tobacco use and the availability of health care professionals are both fairly average. But preventable hospitalization rate and patient satisfaction in Boston both were worse than the national averages.
Engagement (61): This category looked at metrics based on civic and social engagement in the community. Boston ranked very high in Internet access and also fell above the national average of the number of cultural, artistic, and entertainment institutions available. Opportunity for civic involvement and the social involvement index were both about average, while voting rates in the Hub are lower than the national average.
Opportunity (25): This was Boston’s worst ranking of the seven, scoring below average in all of the metrics – income inequality, jobs per worker, high school graduation rate and age diversity.
Interesting post from Scott at Boston.com. The rate rise consensus has swung back and forth. Rates will rise …rates will stay low. Rates are staying low in the short term with increases likely in the long term. How’s that for hedging my bets?
How Long Will Low Interest Rates Continue to Help Buyers?
Even in the super expensive Boston area, rising prices may be not necessarily be the biggest threat to buyers in finding a home they can afford.
Instead, an equal or even greater threat over the next few years may be the likelihood that the low-interest-rate gravy train will finally come to an end, experts say.
Overall, low interest rates have kept mortgage payments low, even as prices in a number of hot Boston-area neighborhoods and suburbs have blown past their price records of a decade ago, real estate stats show.
After a disappointing federal jobs market report at the beginning of April, interest rates actually dipped again, skirting historic lows.
Yet with the Federal Reserve having already signaled its plans to consider boosting the federal funds rate by as early as this summer, the writing is on the wall, said Svenja Gudell, Zillow’s senior director of economic research.
That, in turn, could have major implications for home prices and affordability, here and across the country.
“I don’t think this is the trend,” Gudell said of the recent interest rate dip. “We will see mortgage rates pick up in the long run.”
So how much of a difference do those killer low rates make when buying a house?
The prime rate on a 30-year-mortgage, as of April 9, was 3.66 percent, according to federal mortgage giant Freddie Mac, which surveys banks around the country.
If you took out a $500,000 mortgage to buy a three-bedroom house in Waltham, your monthly payments, at that rate, would amount to $2,290, according to Bankrate’s mortgage calculator.
Now let’s boost the interest rate to 6 or 7 percent. These are rates that were common on mortgages back in the 2000s and were not considered particularly high, either.
At 6 percent, the monthly payment on that Waltham house increases to $2,997 – a 30.8 percent increase.
Boost the rate up another point to 7 percent and the monthly payment jumps again, to $3,326, or a 45 percent increase.
As rates rise, buyers, already scrambling to keep up with rising prices could find themselves with diminishing buying power, at least for a time, anyway.
What happens after that will depend on what prices wind up doing.
In theory, as interest rates rise, sellers will eventually be forced to lower their prices or wind up missing the mark with buyers.
“As rates move, we will see some top down pressure on prices, especially in areas where housing is really too expensive,” said Gudell, the Zillow economist, pointing to Boston, San Francisco, and other high-priced markets.
Still, she doesn’t see rising rates triggering a housing crash, either.
There will be time for the market – and buyers and sellers – to adjust as well, Gudell believes. Rates won’t soar overnight, but are more likely to slowly edge up over time.
“I think the increase will be a gradual one,” she said. “At the end of this year, we will already start to see higher mortgage rates, but we are not going to see rates increase to 4.5 percent or 5 percent right away.”
Pending Sales Surge: Great Sign for the Housing Market
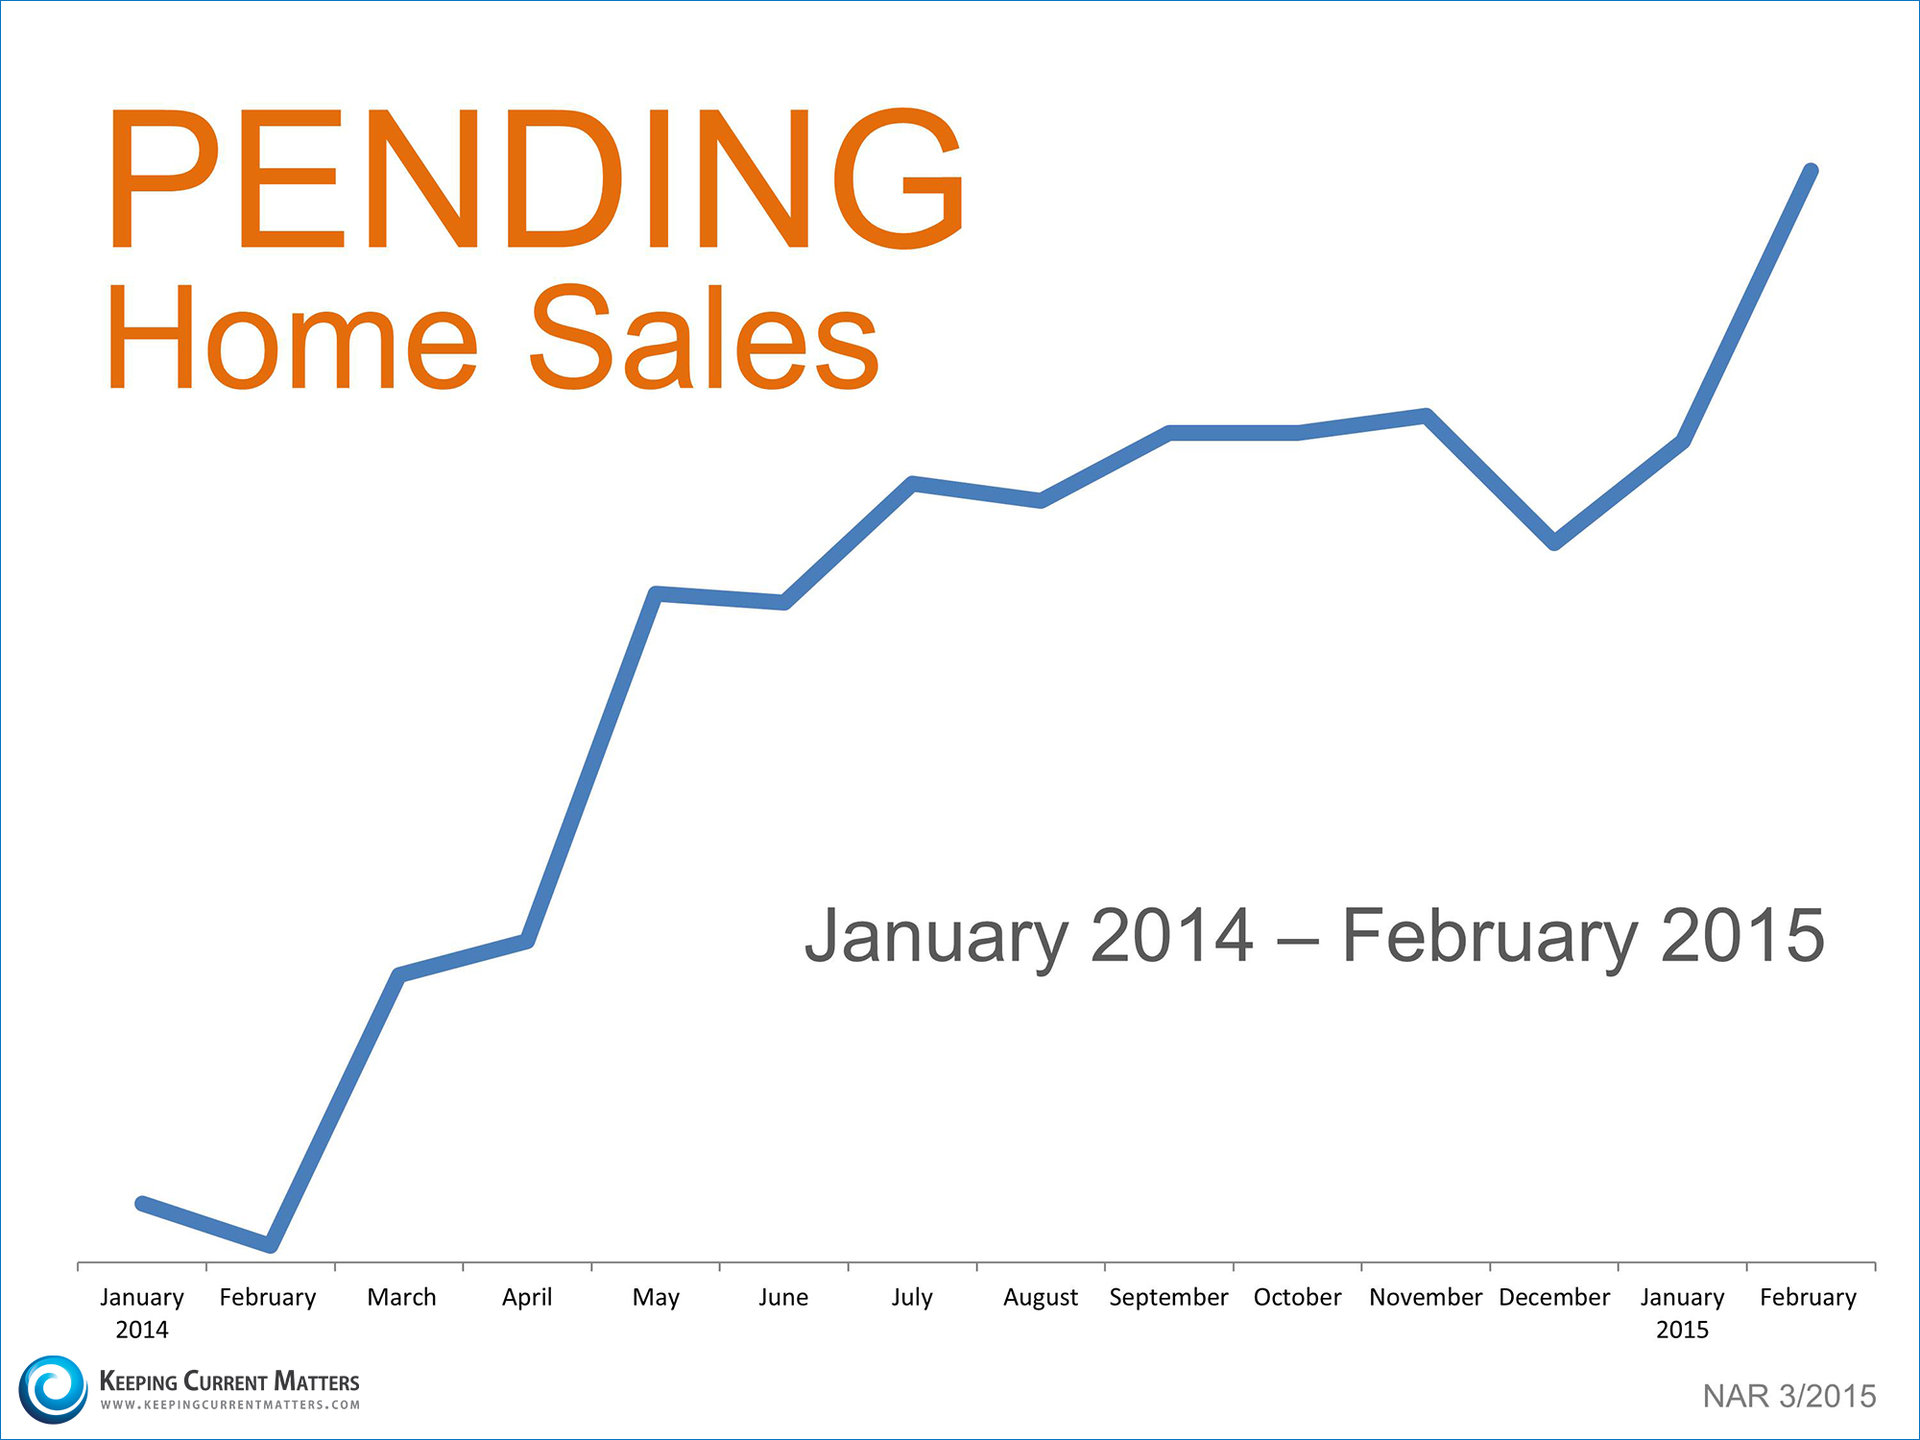
The most recent Pending Homes Sales Index from the National Association of Realtors revealed that homes going into contract in February increased to their highest level since June 2013.
The Pending Home Sales Index is a leading indicator for the housing sector, based on pending sales of existing homes. A sale is listed as pending when the contract has been signed but the transaction has not closed, though the sale usually is finalized within one or two months of signing.
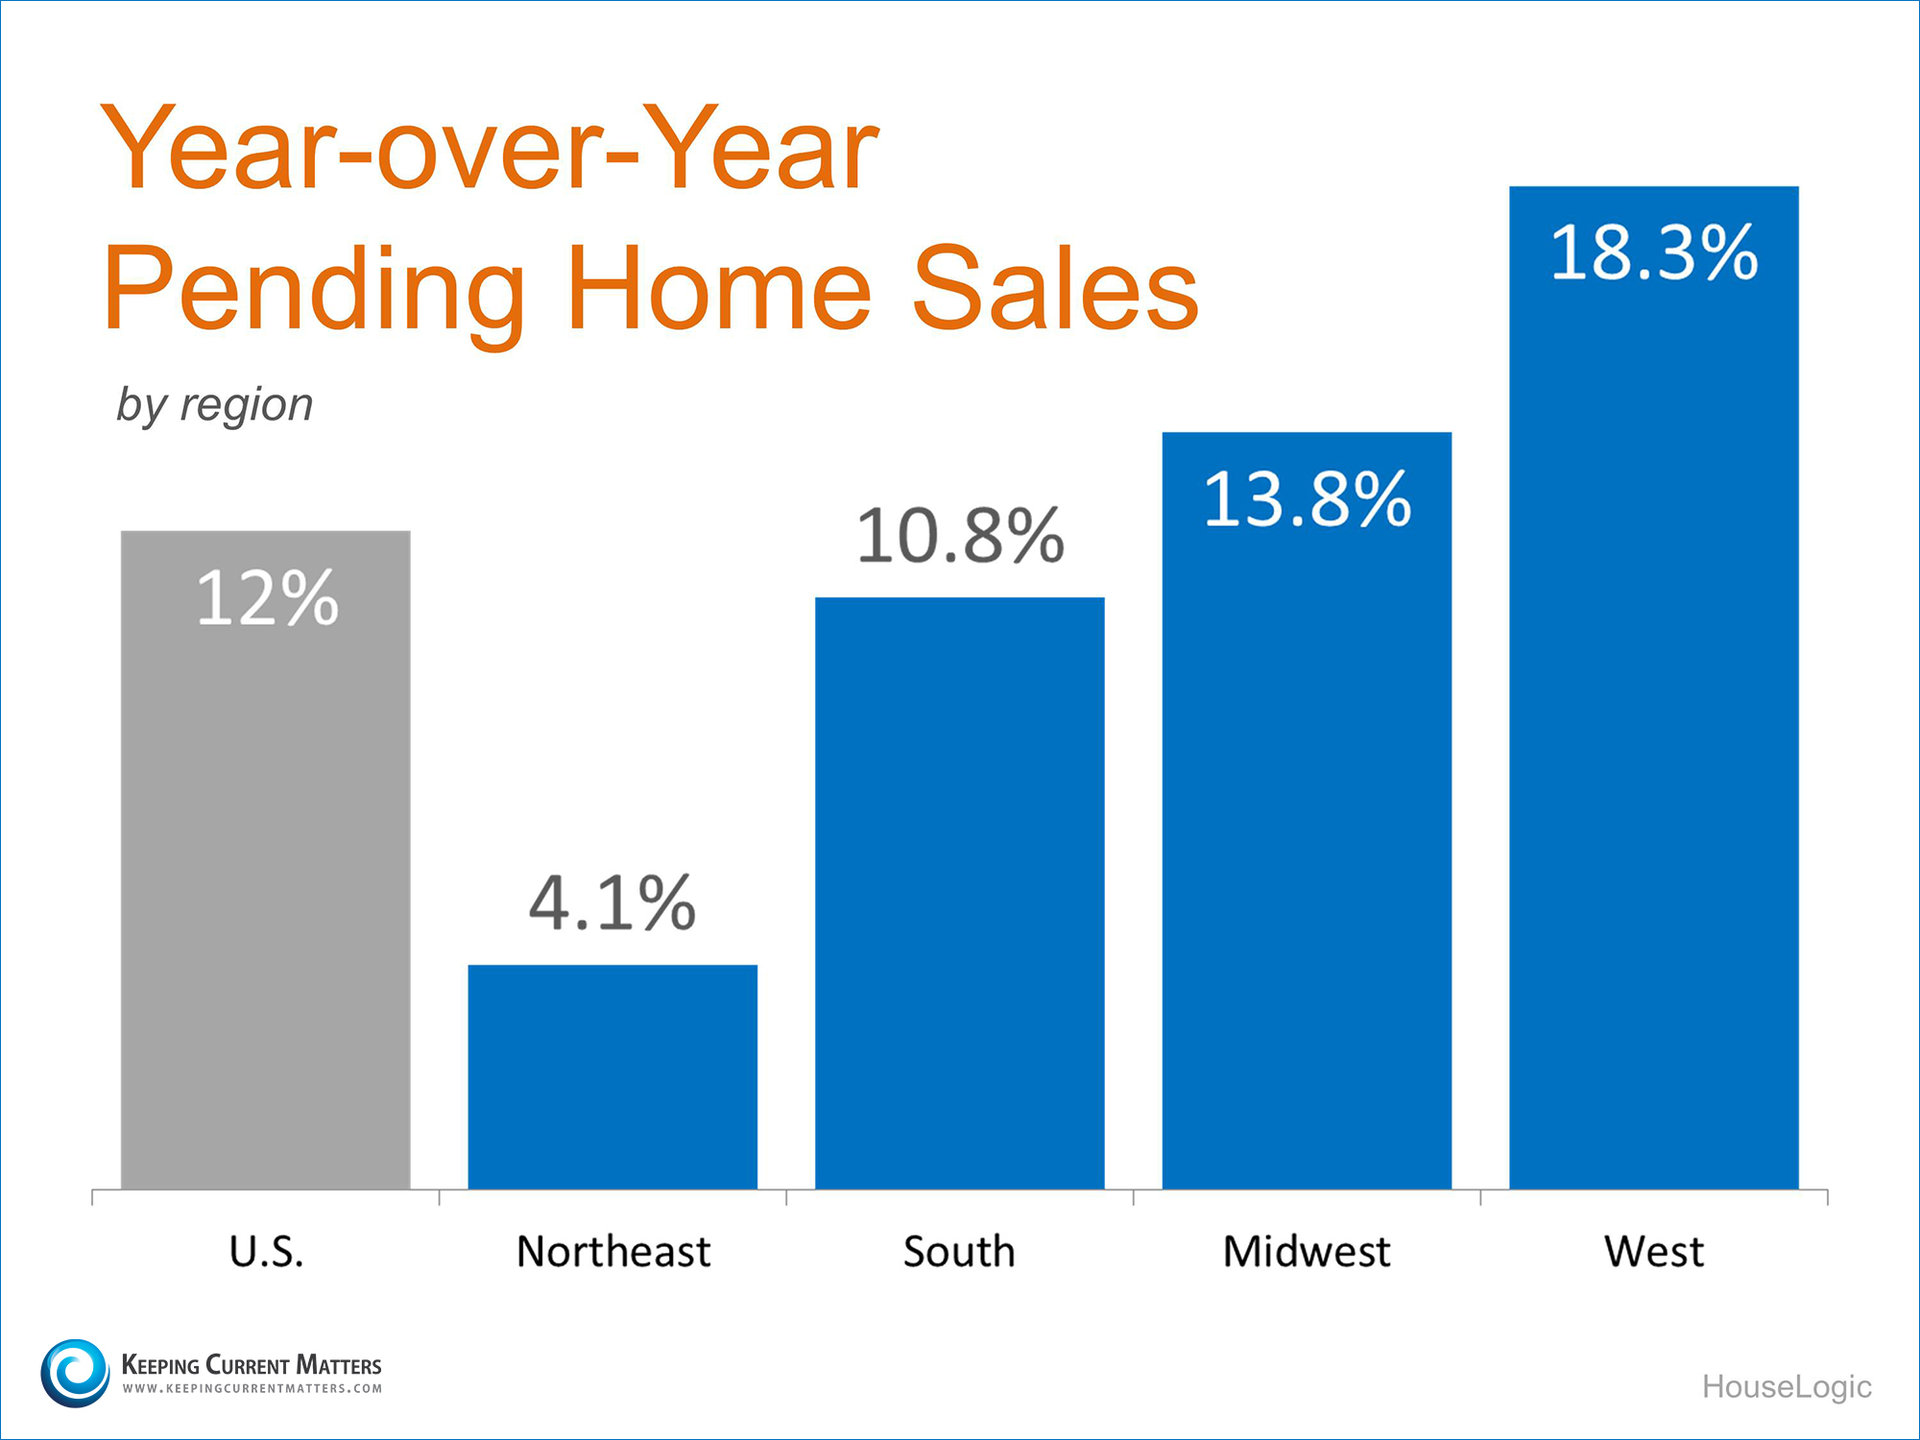
The Index is now 12.0 percent above February 2014. The index is at its highest level since June 2013, has increased year-over-year for six consecutive months and is above what is considered “the average level of activity” – for the 10th consecutive month.
Here is a graph showing the Pending Sales numbers:
Here is a chart showing the Pending Sales increases by region:
Bottom Line
In an article from Investors’ Business Daily, Lawrence Yun, Chief Economist at the National Association of Realtors, explained what these numbers will mean to the overall market:
“It looks like the buyers want to come out to the market and they are eager to find the right home and make an offer. Therefore, I expect the second quarter of this year to be easily ahead of last year in terms of sales activity. Pending contracts are implying that the closing activity in coming months will be quite solid.”
Great post by Scott at Boston.com
The Numbers Behind Boston’s Record-Breaking Year in Development
Boston’s building boom is poised to shift into overdrive over the next few months as two big new tower projects come up for approval at City Hall.
A revised proposal to replace a four-story garage next to the TD Garden with a 46-story residential tower is working its way through the Boston Redevelopment Authority’s vetting process, said Brian Golden, director of the Boston Redevelopment Authority.
And the first of four towers that will replace the Government Center garage eyesore is also moving towards a final approval vote by the BRA’s board, Golden noted.
The progress on the big projects is the latest sign that the handoff of Boston’s development boom to Mayor Marty Walsh has apparently come off without a hitch.
During Walsh’s first year in office in 2014, the Boston Redevelopment Authority gave a green light to 62 projects across the city totaling more than $3 billion.
So far in 2015, City Hall’s development arm has approved another 16 projects, totaling more than $677 million, according to numbers complied by the agency.
“It quite literally has been one of the most active periods for building in Boston’s history.”
All told, 20 million square feet of new development has been green-lit by City Hall over the last few years but have yet to break ground, representing dozens of projects that are coming soon, according to BRA officials.
“That presents a very promising picture about all the projects that are in the pipeline and that will bear fruit in the coming two or three years,” Golden said.
Meanwhile, the amount of new office, lab, residential, and retail space currently under construction has also grown dramatically.
That number has nearly quadrupled to 15.6 million square feet, up from 4.5 million in 2012, according to Nicholas Martin, the BRA’s spokesman.
Projects that have won the blessing of city officials this year include the $290 million Fenway condo and apartment tower, The Point, and an $85 million plan to transform the Chain Forge Building in the Charlestown Navy Yard into a hotel.
“It quite literally has been one of the most active periods for building in Boston’s history,” Martin said.
The numbers also include thousands of new homes, condos, and apartments, with Walsh, like the late Mayor Thomas M. Menino before him, having pledged to make new housing a top priority.
Overall, the Walsh Administration has racked up numbers during its first 15 months in office that appear to match up favorably with Menino’s record — no small matter given Boston’s longest serving mayor’s intense focus on development issues in the city.
Under Walsh, the BRA signed off on plans for 4,158 residential units in 2014, rising to a total of 5,100 if the first three months of 2015 are included.
By comparison, City Hall’s development arm approved 3,898 residential units in 2012 when Menino was mayor. The $3.4 billion in overall development OK’d by the agency that year was on par with the $3 billion under Walsh’s first year.
Behind Boston’s development boom is a diverse economy that is spinning off jobs in a range of sectors, including high-tech, life sciences, and financial services, real estate experts say.
The Hub’s residential, hotel, retail, and office markets are some of the most highly rated in the country when it comes to interest by real estate developers, a new survey by PwC and the Urban Land Institute finds.
There is also pent up demand for new housing amid steady growth in Boston’s population as an eclectic mix of millennials, young families, and empty nesters rediscover urban living.
The big numbers should put to rest early concerns expressed by some in the business community that Walsh might slow down the pace of development in Boston, notes David Begelfer, chief executive of NAIOP Massachusetts, a trade group that represents developers from across the state.
“Things have been moving along,” Begelfer said. “Boston is in boom time right now and it’s not a bubble but a real boom. It is very rational development.”
/cdn0.vox-cdn.com/uploads/chorus_image/image/54482731/Exterior___LJ.0.jpeg)
/cdn0.vox-cdn.com/uploads/chorus_asset/file/8418733/Rooftop_Terrace___LJ.JPG)
/cdn0.vox-cdn.com/uploads/chorus_asset/file/8418741/Living_Room___LJ.JPG)
/cdn0.vox-cdn.com/uploads/chorus_asset/file/8418745/Library_Lounge___LJ.JPG)
