Sales through the 2Q in Provincetown continue to be strong! Growing economic optimism and continued low interest rate have kept buyers and sellers in the market, and almost more importantly, there is a great assortment of properties for sale.
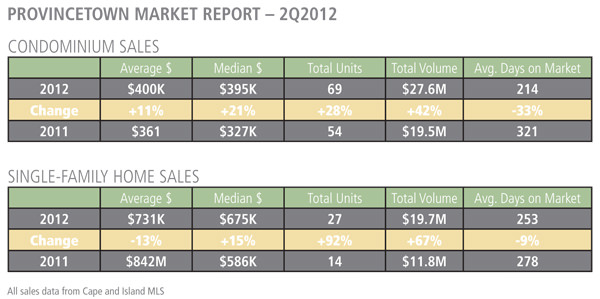
Year-to-date condominium sales through the second quarter surged 28% from 54 sales last year to 69 sales this year. The average sales price of condos sold increased 11% to an average of $400K vs. $361K last year.
Single Family sales did more than surge – they exploded! We went from 14 sales last year to 27 sales through the second quarter. Even with this relatively small sampling, these represent very positive increases. The average sales price of single-family properties sold was $731K. The total sales volume of single-family homes sold was close to $20M – up 67% from last year’s volume of $11.8M.
These figures are evidence that the market has improved markedly year-over-year. More evidence of the market improvement can be seen in both the condo and single-family segments where the average days on market has decreased by 33% and 9% respectively. While we don’t look at days on market with quite the same importance as we do in Boston, DOM’s are a good indication that properties are selling faster and that the inventory of properties for sale is becoming leaner.
Speaking of inventory, as of July 14 there are 157 condominiums for sale in Provincetown, with an average price of $466K and an average price per square foot of $583. And the average days these remain on market is 246.
There are 77 single-family properties for sale with an average price of $1.441M with an average of 2,398 square feet.
We are in the midst of an incredible summer season here in town and this will surely add to the positive real estate news. The number of buyers and of sellers looking to market their properties for sale is up, indicating continued strength and excitement for real estate in our little fishing village.


