Categories
general info

Easy Mortgage Payment Chart.

Terrific post by Colin Robertson at TheTruthAboutMortgage.com

Use This Mortgage Payment Chart to Easily Compare Rates


Now that mortgage rates have gone absolutely haywire, I decided it would be prudent (and helpful) to create a “mortgage payment chart” that details the difference in monthly payment across a variety of interest rates.

So if you were quoted a rate of 3.5% on your 30-year fixed mortgage two weeks ago, but have now been told the rate is closer to 4%, you can see what the difference in monthly payment might be, depending on your loan amount.

Mortgage Payment Chart

Click to enlarge

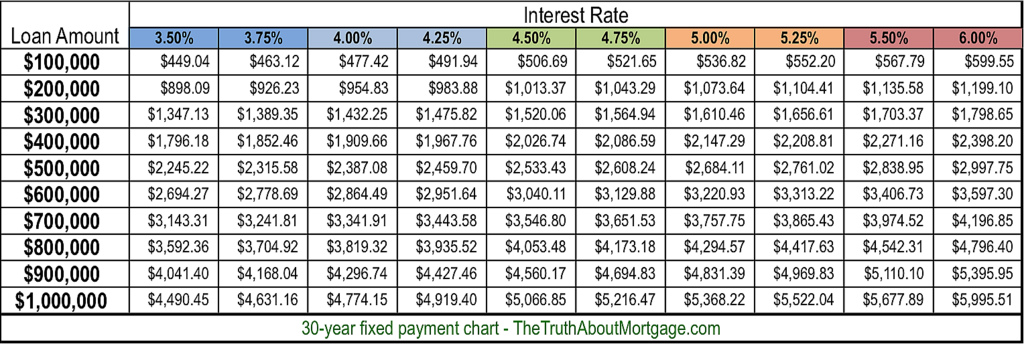
My first chart highlights monthly payments at different rates for 30-year mortgages, with loan amounts ranging from $100,000 to $1 million.

I went with a bottom of 3.5%, seeing that mortgage rates were around that level about a month ago, and probably won’t return there (EVER).

However, there is the possibility that rates could drift back in that direction. And one might be able to buy their rate down to around that price, assuming they want an even lower rate.

For the high-end, I set interest rates at 6%, which is where 30-year fixed mortgage rates were for many years leading up to the mortgage crisis. With any luck they won’t return there anytime soon…

Of course, they could rise even higher over time, but hopefully rates won’t climb back to the double-digits last seen in February 1990.

That fear aside, this mortgage payment chart should give you a quick idea of the difference in payment across a range of interest rates and loan amounts, which should save some time fooling around with amortgage calculator.

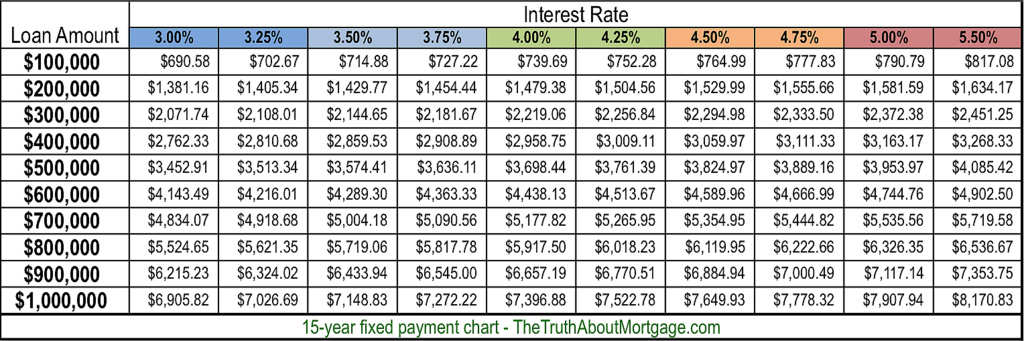
Below is a mortgage payment chart for 15-year fixed mortgages, which are also quite popular.  I used a floor of 3% and a max rate of 5.50%.  Again, rates can and will probably climb higher, just hopefully not anytime soon.

15 Year Fixed Mortgage Payment Chart

Click to enlarge

For the record, you can obtain mortgage rates at every eighth of a percent, so it’s also possible to get a rate of 3.625%, 3.875%, 4.125%, 4.375%, and so on.

Tip: The lower the interest rate, the smaller the difference in monthly payment. As rates move higher, the difference in payment becomes more substantial.

On a $500,000 loan amount, the monthly payment difference between a rate of 3.5% and 3.75% is $70.36, compared to a difference of $77.93 for a rate of 5.25% vs. 5.5%.

Additionally, higher mortgage rates are more damaging to larger loan amounts. If you look at the 30-year chart, the payment on a $400,000 loan amount at 3.50% is cheaper than the payment on a $300,000 loan at 6%.

Lastly, note that my mortgage payment graph only lists the principal and interest portion of the mortgage payment.  You may also be subject to paying mortgage insurance and/or impounds each month. Property taxes and homeowner’s insurance are also NOT included.

You’ll probably look at this chart and say, “Hey, I can get a much bigger mortgage than I thought.”  But beware, once all the other costs are factored in, your DTI ratio will probably come under attack, so tread cautiously.

Categories
general info

What $560K Gets You.

What $560,000 buys you in Boston’s Back Bay, the South End and in Provincetown.

298 Commonwealth Ave, Tandem pkg space, sold $560K

$560,000 buys you a tandem parking space in Boston’s Back Bay.  This was all the news this past week.  You can just imagine what people in the Midwest, or really anywhere else thought when they saw this story.  That Bostonians are Bonkers? Well…everything is relative.  Someone wanted these tandem spots pretty badly, and they could afford $560,000 to buy them


54 W Vine St #A, asking $569K, 2B/3B, 1,248 sf

54 W Vine Street #A in Provincetown’s West End is a wonderful 2 bedroom, 3 bathroom condo with parking.  It just went under contract with an asking price of $569K. This is the 3rd condo that has sold in the last 18 months in this very well run and attractive complex. This condo represents the best of the mid-market in town.


691 Mass Ave, #208, asking $570K. 1B/1B, 909 sf


691 Massachusetts Ave is a one bedroom, one bath condo with an asking price of $570K. 691 Massachusetts Avenue is a newer condo building in Boston’s South End.


We all know that $560K for a parking space in the Back Bay is news. Parking is a rare commodity in the Back Bay and it certainly creates a new ceiling for parking space prices in Back Bay but doesn’t mean much for the market in general…other than adding a bit more confidence to the already very hot market.

Categories
analytics general info

Pending home sales jump 10.3% in one year.

Great national market recap from Tara Steele at Agent Genius.

by 

Pending home sales continue to rise.

9 Telegraph Hill. List price $2.295M Pending.

Although pending home sales improved only 0.3 percent in April, according to the National Association of Realtors, contract signings actually rose 10.3 percent compared to April 2012. Pending sales have now been above year-ago levels for the past 24 months, marking a very slow but somewhat sure recovery for housing.

Regional pending home sales varied, as the Northeast and Midwest saw improvement, while the South and West both dropped. NAR reports that home contract activity is at the highest level since April 2010, immediately before the deadline for the home buyer tax credit which spurred a metaphorical gold rush on homes.

Existing home sales expected to rise to 5M

Dr. Lawrence Yun, NAR’s chief economist said, “The housing market continues to squeak out gains from already very positive conditions. Pending contracts so far this year easily correspond to higher closed home sales in 2013. Total existing-home sales are expected to rise just over 7 percent to about 5 million this year.”

“Because of inventory shortages, higher home sales will push up home values to the highest level in five years,” Dr. Yun added. NAR says the national median existing-home price should increase close to 8.0 percent and exceed $190,000 in 2013.

Sales varied according to region

Home contract activity rose 11.5 percent in the Northeast, marking a 17.7 percent increase from April 2012 and jumped 3.2 percent for the month in the Midwest, and a whopping 15.1 percent for the year.

Meanwhile, pending home sales slid 1.1 percent in the South, but rose 12.3 percent compared to April 2012. The tough spot is currently the West region which saw a 7.6 percent dip in signed contracts, pulling the region down 2.6 percent for the year.

Categories
analytics general info

Shadow Demand Outweighs Shadow Inventory

Very interesting post from Mike Simonsen at Altos Research. In essence he is saying that buyers who held back buying in a sluggish economy are now entering the market in a time of low inventory, creating additional demand, which becomes hard to satisfy.

Real Estate Shadow Demand Outweighs its Shadow Inventory

by MIKE SIMONSEN

Quit your yapping about how strong the real estate market is, Simonsen. It’s a fake rally. There is no actual demand.

That’s the bearish argument I’ve been hearing lately. I’m not buying it.

For years we’ve been watching the phenomenon of “Shadow Inventory” of potential homes that need to be sold, and looking for impact on the market. This set of underwater or distressed properties is now shrinking rapidly.  The number of homes with underwater mortgages fell by nearly two million last year. According to the Fed, home price gains of 10% will be enough to move 40% of underwater borrowers back above water. These home sellers are highly likely to buy another home in the same or comparable market, off setting new supply with new demand.

Meanwhile another phenomenon that emerged from the bubble burst has been developing, and it’s hit the market with full force. Shadow Demand. Demand for homes that went unsatisfied, primarily due to financial and economic uncertainty, that can now emerge as jobs recover and mortgages remain cheap.

Housing’s Shadow Demand

Let’s look at the source of new demand. Increased demand for housing comes from new “households.”

household formation

Cumulative Household formation surpluss/defecit relative to 5 year average (millions). Source: Federal Reserve Bank, Altos ResearchFrom 1997 through 2007, each year an average of 1.3 million new households were formed per year. Our population grows via immigration and kids maturing. These people need to  rent or buy homes, or they double up with friends and family. During the Great Recession, household formation was closer to 600,000 per year. Population growth continued at about the same pace but people didn’t move into homes of their own.  That means for the three years of 2008, 2009, 2010 we had “Shadow Demand” forming around 2 million potential homes that can’t wait to launch on their own.

In the chart above, you can see that households get formed during times of economic strength. People hide when the economy is bad.

Household formation in the five years of the housing bust was lower than any five year period since the 1960s.  This is the Shadow Demand and it’s now hitting the real estate market. These millions of potential buyers were waiting until they were financially stable and until the bargains arrived. In 2012, these conditions converged. In 2013 employment and recovery is stronger. Real estate demand is higher.

Despite all the risks in the US and global economies, the 2012 real estate market’s demand is a function of years of pent up purchases. After years of historic lows, this demand trends seems poised for a multi-year recovery.


Categories
analytics general info

Are 2013 Forecasts Too Low?

Here is a great article by Mike Simonsen of Altos Research.


Why Forecasts for the 2013 Housing Market are Too Low

MARCH  2013

by MIKE SIMONSEN

I’m in Washington DC to talk to the National Association of Business Economics on the state of the housing market. I ran into Lawrence Yun, the chief economist for the National Association of Realtors and he mentioned that he just raised his forecast for 2013 from 4% year over year to 7-8%. That’s pretty bullish. Yun, of course, takes a lot of flack for being an industry cheerleader rather than objective. So he should be bullish, right? I told him he’s still too low.

The logic is this: in 2012 US Housing Prices climbed between 5 and 12%, depending on which measure you choose.  The Case-Shiller Index climbed 6.8% year over year at the end of 2012. Here in 1Q 2013, all the leading indicators are stronger than they were a year ago. (For those of you just tuning in, this is the third in a series of “home prices are stronger than you think” posts from me this winter.)

Contact Altos if you want details on the our housing market data.

2012 (December) 2013 Forecast
Altos Research 7.9% 10%
CoreLogic 6.8% 6%
NAR 11.5% 8%
Clear Capital 4.9% 5%

Note that all these measures, except for Altos, focus on the closed transactions. They are, by definition, lagging. It makes sense that, in an accelerating market, the Altos number is going to hit it’s high several months before the others do.

The always-lucid Bill McBride at CalculatedRisk saw homes prices rise in 2012 but anticipates a slowdown in 2013, though he doesn’t say why.


US Home Prices 2012Composite Prices. Single Family Homes. Altos 20-city (national) composite. Data as of February 22, 2013. Source: Altos Research

If you observe that home prices rose at x% last year and that the conditions (low supply, high demand) that created that rise are stronger this year, it’s reasonable that your models should indicate stronger price appreciation this year. Don’t be surprised when 2013 turns out to be another roaring year for home prices.


Categories
analytics general info

Towns Rush Past Their 2005 Peak Values!

WOW!!!  Interesting post by Scott on BostonRealEstate.com

Posted by Scott Van Voorhis

South End Heli Shot

OK, I guess the rich towns just keep getting richer.

Home values in Cambridge, Arlington and Brookline have all shot past their peaks reached during the bubble yearsZillow finds in its latest quarterly report.

The median home value in Cambridge (yes trolls, I know, it’s a city, was using “town” loosely) is now $463,000, a level last seen back in 2005, one of the bubbliest years on record. That’s compared to $453,000 in April, 2005.

Brookline last fall blew past its 2005 price peak of $502,000, with the median home value having skyrocketed over the past five months to just under $530,000, according to Zillow, whose home value index blends both prices of homes sold with assessed values of homes that are not on the market. (Basically, it’s a measurement of the value of all homes in the market, not just a compendium of sale prices.)

Arlington is back as well, with a median home value of $475,000 – higher than Cambridge.

That’s compared to Arlington’s bubble years’ peak of $463,000 reached back in October, 2005, Zillow reports.

Meanwhile, other local cities and towns are on target to equal and then pass their 2005 peaks over the next year.

Boston’s median home value is $372,900, a single percent below peak, while Newton, at $714,400, is just two percent off, Somerville, at $381,400, is within striking distance, at 5 percent below its last peak.

Ready to party? What’s the value of your home?


Categories
analytics

What’ s Keeping Sellers From Selling?

As we are all assessing the outlook for the spring market, Scott at Boston.com has some good points, and while this post is based on national polls, we are hearing the same thing in our marketplaces.  Sellers wonder if they do list and sell there propertry, will there be anything decent to buy! An important question as we move into the spring selling season.


Really, why shouldn’t sellers wait for higher prices?

Posted by Scott Van Voorhis

That’s the question many potential home sellers are asking as they watch prices climb again in an increasingly tight market.

Would-be home sellers, as they consider taking the plunge, are no longer primarily concerned with the state of the economy in deciding whether to list their house now or wait. Instead, the top concern now is whether by selling now, they will pass up even bigger gains down the line if they should choose not to hold out for a few more months, Redfin reports in a new survey on seller attitudes.

It’s not that they are not interested in selling – just under half the more than 1,800 homeowners polled by Redfin said they were planning to sell, up from 45 percent in the fourth quarter. (Just to be clear, this was not a broad sampling, but rather a tally of homeowners who visited Redfin’s website.)

But 34 percent  of homeowners surveyed told Redfin that missing out on future gains was their biggest concern with diving in now, up from 30 percent at year end. Moreover, potential sellers are also growing increasingly bullish in their take on the market as well, with 81 percent now predicting more increases in home prices over the next year, up from three-quarters last fall.

Needless to say, with warmups beginning for the annual spring market, this is not a good sign. In fact, we could see some sellers sit out the spring market altogether, waiting to see if prices continue to rise. After that, we could see new inventory start to trickle on, but it seems unlikely at this point we are going to see an avalanche of new listings in the next few months.

That’s my bold prediction – feel free to jump on the comment board with your own take.

It’s certainly not what frustrated buyers, yearning for more listings to choose from, want to hear, but the market is what it is right now.

Of course, there are other factors at work here. Any broker will tell you another big concern of potential home sellers, especially here in the Boston, is the fear they won’t be able to buy anything decent if they go ahead and sell what they have now.

Not unreasonable given the precipitous drop in home listings, which fell by more than 25 percent in Boston alone over the past year, helping push prices up 4.1 percent, according to the Department of Numbers.

So why shouldn’t sellers keep holding out for more? Until buyers and brokers come with a better argument – or really any counterargument at all – sellers are likely to keep on watching and waiting instead of listing.


Categories
analytics

Tight Inventories Effect Growth Prospects.

The Inman News article below provides interesting national context to the extreme lack of inventory in our local markets.

NAR: Pending sales dip from November to December

BY INMAN NEWS

Inman News®

Tight listing inventories are likely to constrain growth in 2013 home sales, the National Association of Realtors said in releasing a report showing that pending sales dropped 4.3 percent from November to December.

Despite the month-to-month drop, existing homes under contract were up 6.9 percent from a year ago, making December the 20th month in a row to see an annual gain in pending sales.

NAR’s Pending Home Sales Index, which represents existing-home contracts signed but not yet closed, rose to 106.3 in November before slipping to 101.7 last month. In April 2010, when the federal homebuyer tax credit was still in place, the index hit 111.3, but soon dipped back down.

An index score of 100 is equal to the average level of sales contract activity in 2001, the first year examined by the trade group and a year in which home sales fell in what’s considered a normal range for the current U.S. population. Contracts signed in a month typically close one or two months later.

Although NAR is projecting that home sales will pick up by 9 percent in 2013, tight inventory, paired with near-record low new-home construction levels, is an obstacle to more rapid growth.

The month-to-month dip in the pending sales is not a “statistical fluke,” Yun said, but signals a loss of momentum in home sales. The momentum, however, is inventory-related, he said — demand is still high.

New homes, Yun said, are the solution to the inventory challenge. “True relief to the inventory has to come from new home construction.”

Regionally, the West, with extremely tight inventory, was the only region to see a decrease in pending home sales in December from a year ago with a 5.3 percent drop.

December 2012 year-over-year change in pending sales of existing homes index by region

Source: National Association of Realtors

The Midwest, South and Northeast had year-over-year index increases of 14.4 percent, 10.1 percent and 8.4 percent, respectively, in December.

On a monthly basis, only Midwest’s index increased in December — 0.9 percent. The pending existing-home sales index fell in the West, Northeast and South from November to December 8.2 percent, 5.4 percent and 4.5 percent, respectively, in December from November.

Categories
analytics

Local Market Best Since ’06’

A great article below from The Boston Globe’s Jennifer McKim. 
  • The Boston Globe
  • By Jenifer B. McKim

The Massachusetts housing market made a comeback last year, with 46,887 single-family homes sold — the best showing since 2006!

Single-family home sales statewide rose by 18.4 percent in 2012 compared with 2011,according to Warren Group, a private company that tracks real estate. Prices also rose, with the median price, or midpoint price, climbing a modest 1.8 percent compared with 2011, to $290,000.The new data seem to confirm what housing specialists have been saying for months — that the Massachusetts and US housing markets have turned a corner. The state’s single-family housing market hit a price peak in 2005 — at $355,000 — before dropping about 20 percent by 2009, Warren Group said. Home values have fluctuated, but now appear to be strengthening steadily, especially in the Boston area.This year “is going to be the base the housing recovery is built on,’’ said Alex Coon, a Boston market manager for the online brokerage firm Redfin.The state’s condominium market also is improving, with sales rising more than 25 percent in 2012 compared with the previous year, marking the highest number of condo sales in Massachusetts since 2008,according to Warren Group. The median condo sale price rose $277,000 in 2012, up 2.6 percent from 2011.The annual data were given a boost by brisk activity in December. Single-family home sales jumped by 8 percent compared with December 2011. Median home values rose to $300,000, a 12.3 percent increase compared with the same time in 2011, according to Warren Group.Condo sales also increased by 5.4 percent in December, compared with December 2011. The median condo sale price increased to $275,000 last month, 8 percent higher than during the previous December.

“It is clear we have turned the corner and are gaining ground rapidly,’’ said Timothy M. Warren Jr., chief executive of Warren Group.

Greater Boston showed even better numbers in 2012, with the median price for singlefamily homes hitting $470,000, 6.8 higher than in 2011, the Greater Boston Association of Realtors said. The group includes communities largely within the Interstate 495 loop. Condo prices in that region rose to $380,000, a 10.3 percent increase compared with 2011.

But as more buyers compete for homes, the number of properties on the market continues to shrink.

The inventory of single-family homes fell by 28.1 percent at the end of December, compared with 2011, according to the Massachusetts Association of Realtors, which also released data Thursday.

The number of condos for sale fell by 34.3 percent in December, compared with 2011, the association said.

John Ranco, senior associate at Hammond Residential Real Estate in Boston’s South End, said the lack of homes to sell is proving a challenge to the market’s recovery.

“We seem to have lots and lots of people looking for housing and very, very little to choose from,’’ he said. “It’s a little bit of a horse race to get properties into agreement right now.”

Christopher Doherty, president of the Northeast Association of Realtors, said he hopes more people start to realize now is a good time to put their homes on the market. “Buyers are out looking now, and every property that comes to the market is getting tremendous attention,” he said.

Categories
architecture general info

Changes In The Old Neighborhood

Interesting story on southendpatch.com regarding the wonderful wooden house on Taylor Street in the South End right off of Dwight Street . Hopefully things will work out to everyones satisfaction as it is a very special property and one which many south-enders are so familiar with.

Neighbors on Taylor St. House Demolition: Conditions Were Unsafe

The original stop work order put on the 8-10 Taylor Street wooden house property was because of environmental and project concerns, neighbors say. Now, it’s related to an entirely different issue.

Imagine sitting in your home one morning and feeling the entire floor shake. That’s how Taylor Street resident Louane Hann was notified of the construction happening on her street last Tuesday.

“I was working from home, and all of a sudden, I felt the earth move,” she said. “There was a guy with a backhoe and a guy with a hose, and they were ripping the house down.”

Hann said neither she nor anyone else in the neighborhood was notified that construction would begin at the wooden house at 8-10 Taylor Street, and that it would involve demolition of the building.

“We get notices about someone getting a roof deck you can’t even see half the time, and no one got a notice about this,” she said. “It’s unbelievable.”

Couple the lack of notice with the complete surprise that the building, which neighbors thought had been approved for a renovation and addition, was being completely demolished. And the day of demolition left dust everywhere, debris on neighbors’ porches and properties, and even broke a window at a home next door, said nearby residents.

“During the demolition I saw two kids standing outside watching, and I remember thinking, ‘Is it safe for those kids to be breathing that?” Hann said. “All of these old homes have lead in the paint,” she said.

Neighbors said they called Boston’s Enviornmental Department to complain about the mess and to voice the worry that the old home contained lead paint that was now swirling through the air on their street.

Through those calls to the city, the Landmarks Commission learned that an extra wall on the property was demolished that was not included in the project’s original plans, the home’s east wall.

A stop work order was posted on Friday, Jan. 25th and the owner was asked to appear at a public meeting of the Landmarks Commission on Tuesday.

By Monday, Jan. 28th, the project’s architect Scott Slarsky said the city’s Inspectional Services team had come through the site and determined there was no asbestos or lead paint, and lifted the stop work order due to the environmental concerns. But that still left a stop work order related to the site’s demolition of the property’s east wall.

Property owner Ramy Rizkalla said contractors and inspectors found the east wall was bowing in, it was rotting, and there was termite damage, and a structural engineer ruled the wall was unsafe to leave on the property. Rizkalla said the decision to take down the wall was approved by the city’s Inspectional Services department. However, it is the Landmarks Commission that requested the hearing on Tuesday.

“Though they aren’t going to comment on the design of the east wall, they did want to review the rebuilding, so that’s what we’re going in for on Tuesday,” Rizkalla said.

So for now, the project is still on hold until Tuesday night’s meeting of the South End Landmarks Commision. The meeting will take place at 6:45 at Boston City Hall, room 801.

But for neighbor Hann and other neighbors who feel like they were fed some kind of bait and switch between the plans that were presented to them and the actual demolition, the damage is already done.

“We’ve lived there about 20 years and really value that house as one of two remaining wooden houses in the South End,” said Hann, who wasn’t in favor of the orignal plans to begin with because she felt certain modern elements in the design didn’t fit in with the neighborhood. The demolition of the extra wall adds insult to injury, she said, calling it “obnoxious and insulting.”

“Now it’s really heartbreaking to look at that house,” she said.