Categories
general info

Goode and Farmer Report – Provincetown, Truro, Wellfleet July 2013

Provincetown year-to-date sales moderated somewhat from a robust 2012 first half as a shortage of properties for sale and a harsh winter kept buyers on the sidelines. Recently the market ticked up markedly as the weather improved.

Condominium sales slowed by 27% from 69 units last year to 50 this year, although a sluggish 16 sales in 1Q more than doubled in 2Q to 34. The average sales price of condos sold stayed relatively flat at $390K – a 2% decrease from $400K last year. Days on market for condominiums sold decreased by 8%; further illustrating the lack of inventory.

Single-family properties performed well with a 24% increase in the average sale price from $731K in 2012 to $905K year-to-date. The median sales price increased 28% to $867K from last years $675K – 22 have sold so far this year against 27 last year. Total sales volume was up 1% to $19.7M.

The average days on market has decreased in both categories driven by less inventory available for sale and relatively strong demand. For condos, it decreased 8% from 214 to 197 and for single-family properties, DOM decreased 22% from 253 to 197. Properties are selling faster as there are fewer on the market and demand remains very high.

Speaking of inventory, currently there are 110 condos on the market with an average listing price of $470K and an average price per square foot (ppsf) of $557. There are 54 single-family properties on the market with an average listing price of $1.411M and an average ppsf of $558.

The market has heated up in the past several weeks with several properties going under contract. The most interesting development is that two, $2M+ houses on Telegraph Hill went under contract in the past few weeks. The number of properties going U/A has increased noticeably. It has turned into summer overnight and the fourth of July has come and gone. The season is in full swing!

Ptown 2Q 2013


Other towns on the Outer Cape have experienced a similar dynamic. The number of single-family home sales in Truro was down 13% to 26 units from 30 in 2012. The average sales price was down 18% to $607K from $737K last year.

The Truro market consists mostly of single-family homes. There are currently 72 single-family properties available to chose from.

In Wellfleet, the single-family market performed better than last year with a 4% increase in the average sales prices to $556K from last year’s $533K. The number of sales was the same as in 2012 at 32 properties sold. The current 93 single-family homes available for sale offer many choices for buyers.

Truro 2Q 2013


There is generally positive news on the outer Cape in both single-family homes and condominiums. A strong second-home market on the Cape is an indication of an improving economy and of improving consumer confidence. These buyer and seller attitudes and still relatively low interest rates are signaling a very strong second half for outer Cape real estate.

Please call or stop in if you are considering selling or if you are just curious as to what your home is worth. If you are considering buying a home, remember that our business philosophy is that the best-informed buyers are the happiest and it is what we do best.


Categories
general info

WOW! Herring Cove Bath House and Farland’s Food Too!


Top Photo
Work crews finish up the final touches at the new Herring Cove bath house, slated to open soon in Provincetown.Cape Cod Times/Steve Heaslip
June 26, 2013

PROVINCETOWN — The new bathhouse at Herring Cove Beach will open Saturday as summer crowds really start to arrive at the Cape Cod National Seashore’s most popular swimming beach.

The $5 million facility is a marked departure from the beige and dank 1950s-era bathhouse demolished last fall. In its place are four shingled cottages, about 400 to 600 square feet each, sitting on pilings and connected with wide decks. Each building takes care of the small things to make for a good time at the beach: changing into swimsuits, taking a quick bathroom break and downing cold drinks and food. The outdoor areas seem open and inviting enough, with broad views of the sea, that they might be a place people could gather in the evening.

“We talked about it being a destination,” Seashore Deputy Superintendent Kathy Tevyaw said as she stood Tuesday with her back to the sea, facing the new buildings, in near 80-degree heat. Workers were scrambling to complete a cedar-framed trellis that will provide shade on the decks. Benches still needed to be installed and signs hung. Shingles on two buildings are arranged to resemble a whale and a sea turtle to reflect the animal life nearby.

The upgrades are both fun and serious, according to National Park Service project manager and architect Amy Sebring.

The bathhouse — like plans for the beach’s northern parking — has been designed to withstand the effects of climate change, such as rising seas and fierce winter winds, and to allow dunes to migrate naturally. The buildings and decks have been pulled back at least 100 feet from the edge of the coast and raised about 4 feet. The modular design could make it possible to move the buildings even farther back. The posts for the trellis can withstand 150 mph winds, Sebring said.

“This will still be standing,” Sebring said with her hand on a post, somewhat jokingly, when other structures in town have been flattened.

“Structural integrity is a big agenda for the National Park Service as a whole,” she said.

The beach had 876,000 visitors in 2012, according to the National Park Service.

The Seashore received money to rebuild the bathhouse two years earlier than expected, in part because of the previous building’s poor condition, its vulnerability to heavy surf and erosion, and the need to use money that was at risk of not being available later, Sebring and Tevyaw said last fall. A plan to move the 208-spot northern parking lot back about 125 fee back and 15 feet higher will, according to Seashore officials, help protect it from storm erosion and maintain a favorite drive-up spot for the beach.

Even the food served at the new bathhouse’s snack bar has a forward-thinking vibe, with the recent launch within the National Park Service of a move toward more healthful and sustainable food. A Provincetown business, Far Land Provisions, has won a three-year contract to run the snack bar, Seashore Superintendent George Price announced Thursday in a written release. Far Land Provisions is a food store, deli, bakery and catering company on Bradford Street. The snack bar will open next week, with hours probably from just before lunch to sunset, co-owner Tom Boland said Tuesday.

“We’re very excited,” Boland said. “It’s a beautiful facility. They have done such an amazing job.” Rest assured, Boland said, the snack bar will definitely be serving hot dogs.


Categories
general info

Mass Housing Sales And Prices Surge In May

Jenifer’s Wednesday Globe article illustrates the growing confidence and underlying challenges with the Massachusetts housing market surge.

Mass. housing market continues to recover

By Jenifer B. McKim

|  GLOBE STAFF  JUNE 26, 2013

<br /><br /><br /><br /><br /><br /><br /><br /><br /><br /><br /><br /><br />

Home sales climbed 6 percent from May 2012, while the median home price increased by nearly 12 percent to $324,500, according to the Warren Group, a Boston company that tracks local real estate. It was the fourth consecutive month of double-digit price increases.

The housing recovery is accelerating as buyers — cognizant that home values are on the upswing — compete for a limited supply of properties, prompting bidding wars and huge increases in prices in many popular neighborhoods. Rising interest rates also are pressuring buyers to get into the market now.

While still historically low, the average rate on a 30-year mortgage has risen to about 4 percent from 3.6 percent a month ago, according to Inside Mortgage Finance, a Maryland-based trade newsletter.

“Prospective buyers have displayed a voracious appetite for real estate this year,” said Sam Schneiderman, president of the nonprofit Massachusetts Association of Buyer Agents. “Many buyers are finding themselves playing a game of ‘beat the clock’ to buy a house before rising prices and interest rates impact their ability to buy a home that they can afford.”

The recovery in Massachusetts reflects the strengthening housing market nationally as unemployment falls, incomes rise, and consumer confidence improves. The Commerce Department said Tuesday that US sales of new homes in May surged 29 percent from a year ago. S&P/Case-Shiller Home Price Indices, a well-reputed measure of the housing market’s health, reported an average price increase of about 12 percent in the 20 metropolitan areas the index tracks.

Home values in San Francisco surged 23.9 percent in April from April 2012, while Las Vegas values rose 22.3 percent, according to the Case-Shiller index. The Boston area experienced an 8.1 percent increase.

Karl E. Case, cocreator of the index, said appreciation in the Boston area appears to be moving at a sustainable pace. Home values in Boston peaked in 2005 and fell about 20 percent before hitting bottom in 2009, according to the index. They remain about 13 percent below their peak.

Case said he is concerned that other areas of the country, particularly California, may be heading toward another bubble. “There’s a bunch of exuberance out there,” Case said.

In Boston, tight inventories of homes for sale have pushed prices higher. The lack of homes on the market has also constrained sales: In the first five months of the year, sales in Massachusetts declined slightly from the same period in 2012, according to the Warren Group.

Many economists expect the strong price increases to moderate as more sellers put homes on the market and interest rates rise. “Buyers expecting home values to continue rising at this pace indefinitely may be in for a shock,” said Stan Humphries, chief economist for Seattle-based real-estate company Zillow.

Despite the improving economy and housing market, many struggling homeowners and renters are not benefiting from the housing recovery, said Eric Belsky, managing director for the Joint Center for Housing Studies at Harvard University.

The center is expected to release a report Wednesday that shows millions of US homeowners still behind on mortgages or owning homes worth less than the amount of their mortgages. The study will also note that banks are maintaining tight lender standards that are blocking would-be home buyers from loans while mortgage rates are low and prices reasonable.

“Tight credit is limiting the ability of would-be home buyers to take advantage of today’s affordable conditions and likely discouraging many from even trying,” said Chris Herbert, the center’s director of research.

Jenifer B. McKim can be reached at [email protected]. Follow her on Twitter @jbmcki

Categories
general info

Buy Now?

One of my new favorite real estate blogs is KCM.  A great post below clearly illustrates the simple reasons that buying now may not be a bad idea. Don’t you love the perfect nuclear family pictured? They don’t look particularly happy. Just saying! I don’t normally post “buy now”, “sell now” articles but occasionally they organize information and provide a bit of national context to our own micro market here.

Buying a House: Is Now the Time?

by THE KCM CREW 

bored

The real estate community is often criticized for always seeming to have a Pollyanna attitude about the housing market. Many believe that the industry’s current call ‘to buy now’ is nothing more than a scare tactic with the sole purpose of creating more commissions for the industry. Let’s take a look at whether or not that advice was good advice over the last year.

The ‘cost’ of a home is determined by two major components: the price of the home and the current mortgage rate. According to the most recent Case-Shiller Home Pricing Index, home values have risen over 10% in the last year. If we look at Freddie Mac’sWeekly Primary Mortgage Market Survey®, the 30 year mortgage rate has increased from 3.67% to 3.91% during that same period.

The table below compares the cost of the same exact house over the last twelve months:

difference

We can see that the advice to buy a year ago made complete financial sense.

What About Moving Forward?

Most experts are not only calling for prices to continue to rise but are also upgrading their projections as the housing market is showing strong signs of recovering.

Regarding interest rates, the 30 year mortgage rate has soared by over a half point already this year and many believe that the increases will continue. Even those trying to be the voice of reason on this issue are projecting higher rates. For example, Polyana da Costa, senior mortgage analyst at Bankrate.com said:

“Rates are unlikely to keep going up so quickly and should remain below 5 percent.”

Bottom Line

The next time a real estate professional says that now is the time to buy they may not be giving you a ‘sales pitch’. They may be giving you nothing but excellent advice.


Categories
general info

Easy Mortgage Payment Chart.

Terrific post by Colin Robertson at TheTruthAboutMortgage.com

Use This Mortgage Payment Chart to Easily Compare Rates


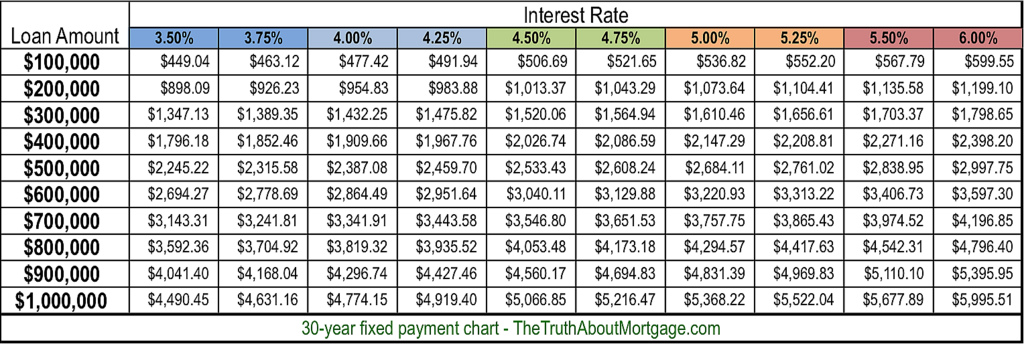
Now that mortgage rates have gone absolutely haywire, I decided it would be prudent (and helpful) to create a “mortgage payment chart” that details the difference in monthly payment across a variety of interest rates.

So if you were quoted a rate of 3.5% on your 30-year fixed mortgage two weeks ago, but have now been told the rate is closer to 4%, you can see what the difference in monthly payment might be, depending on your loan amount.

Mortgage Payment Chart

Click to enlarge

My first chart highlights monthly payments at different rates for 30-year mortgages, with loan amounts ranging from $100,000 to $1 million.

I went with a bottom of 3.5%, seeing that mortgage rates were around that level about a month ago, and probably won’t return there (EVER).

However, there is the possibility that rates could drift back in that direction. And one might be able to buy their rate down to around that price, assuming they want an even lower rate.

For the high-end, I set interest rates at 6%, which is where 30-year fixed mortgage rates were for many years leading up to the mortgage crisis. With any luck they won’t return there anytime soon…

Of course, they could rise even higher over time, but hopefully rates won’t climb back to the double-digits last seen in February 1990.

That fear aside, this mortgage payment chart should give you a quick idea of the difference in payment across a range of interest rates and loan amounts, which should save some time fooling around with amortgage calculator.

Below is a mortgage payment chart for 15-year fixed mortgages, which are also quite popular.  I used a floor of 3% and a max rate of 5.50%.  Again, rates can and will probably climb higher, just hopefully not anytime soon.

15 Year Fixed Mortgage Payment Chart

Click to enlarge

For the record, you can obtain mortgage rates at every eighth of a percent, so it’s also possible to get a rate of 3.625%, 3.875%, 4.125%, 4.375%, and so on.

Tip: The lower the interest rate, the smaller the difference in monthly payment. As rates move higher, the difference in payment becomes more substantial.

On a $500,000 loan amount, the monthly payment difference between a rate of 3.5% and 3.75% is $70.36, compared to a difference of $77.93 for a rate of 5.25% vs. 5.5%.

Additionally, higher mortgage rates are more damaging to larger loan amounts. If you look at the 30-year chart, the payment on a $400,000 loan amount at 3.50% is cheaper than the payment on a $300,000 loan at 6%.

Lastly, note that my mortgage payment graph only lists the principal and interest portion of the mortgage payment.  You may also be subject to paying mortgage insurance and/or impounds each month. Property taxes and homeowner’s insurance are also NOT included.

You’ll probably look at this chart and say, “Hey, I can get a much bigger mortgage than I thought.”  But beware, once all the other costs are factored in, your DTI ratio will probably come under attack, so tread cautiously.

Categories
general info

What $560K Gets You.

What $560,000 buys you in Boston’s Back Bay, the South End and in Provincetown.

298 Commonwealth Ave, Tandem pkg space, sold $560K

$560,000 buys you a tandem parking space in Boston’s Back Bay.  This was all the news this past week.  You can just imagine what people in the Midwest, or really anywhere else thought when they saw this story.  That Bostonians are Bonkers? Well…everything is relative.  Someone wanted these tandem spots pretty badly, and they could afford $560,000 to buy them


54 W Vine St #A, asking $569K, 2B/3B, 1,248 sf

54 W Vine Street #A in Provincetown’s West End is a wonderful 2 bedroom, 3 bathroom condo with parking.  It just went under contract with an asking price of $569K. This is the 3rd condo that has sold in the last 18 months in this very well run and attractive complex. This condo represents the best of the mid-market in town.


691 Mass Ave, #208, asking $570K. 1B/1B, 909 sf


691 Massachusetts Ave is a one bedroom, one bath condo with an asking price of $570K. 691 Massachusetts Avenue is a newer condo building in Boston’s South End.


We all know that $560K for a parking space in the Back Bay is news. Parking is a rare commodity in the Back Bay and it certainly creates a new ceiling for parking space prices in Back Bay but doesn’t mean much for the market in general…other than adding a bit more confidence to the already very hot market.

Categories
general info

Tipping Point?

Interesting post by Scott.

“Tipping point” for housing market?

Posted by Scott Van Voorhis  June 12, 2013 08:22 AM

South End Heli ShotOK, when Realtors start talking about the market reaching a “tipping point,” it can only be bad news for buyers worried about soaring prices.

It means things are starting to get a little crazy.

As we head into summer, sales activity is soaring, with buyers spooked by rising rates and the prospect of more price hikes ahead.


More than 9,000 homes across Massachusetts were put under agreement this May, an 83 percent jump from May 2012, the Massachusetts Association of Realtors reports.

Pending sales of condos rose more than 63 percent in May, to 3,469.

Both increases where the highest recorded since MAR began tracking pending sales in 2004.

Here’s what President Kimberly Allard-Moccia, president of the local Realtors group, had to say.

“May was a tipping point as increasing prices and interest rates pushed qualified buyers to make offers that sellers accepted in great numbers,’ said Allard-Moccia, broker-owner of Century 21 Professionals in Braintree, in a press statement.

“However, we still need more homes on the market and hopefully this activity will spark potential sellers to list their homes to help meet the demand,” she added.

Tipping point?


Categories
analytics general info

Pending home sales jump 10.3% in one year.

Great national market recap from Tara Steele at Agent Genius.

by 

Pending home sales continue to rise.

9 Telegraph Hill. List price $2.295M Pending.

Although pending home sales improved only 0.3 percent in April, according to the National Association of Realtors, contract signings actually rose 10.3 percent compared to April 2012. Pending sales have now been above year-ago levels for the past 24 months, marking a very slow but somewhat sure recovery for housing.

Regional pending home sales varied, as the Northeast and Midwest saw improvement, while the South and West both dropped. NAR reports that home contract activity is at the highest level since April 2010, immediately before the deadline for the home buyer tax credit which spurred a metaphorical gold rush on homes.

Existing home sales expected to rise to 5M

Dr. Lawrence Yun, NAR’s chief economist said, “The housing market continues to squeak out gains from already very positive conditions. Pending contracts so far this year easily correspond to higher closed home sales in 2013. Total existing-home sales are expected to rise just over 7 percent to about 5 million this year.”

“Because of inventory shortages, higher home sales will push up home values to the highest level in five years,” Dr. Yun added. NAR says the national median existing-home price should increase close to 8.0 percent and exceed $190,000 in 2013.

Sales varied according to region

Home contract activity rose 11.5 percent in the Northeast, marking a 17.7 percent increase from April 2012 and jumped 3.2 percent for the month in the Midwest, and a whopping 15.1 percent for the year.

Meanwhile, pending home sales slid 1.1 percent in the South, but rose 12.3 percent compared to April 2012. The tough spot is currently the West region which saw a 7.6 percent dip in signed contracts, pulling the region down 2.6 percent for the year.

Categories
general info

Rising Rates!

interesting post on rising rates from Scott at Boston.com

Will rising rates spur panic buying?

Posted by Scott Van Voorhis

But before the chill sets in, sales could very well go into overdrive as buyers seek to lock in rock-bottom rates before they are gone.

Interest rates have just topped 4 percent. OK, that’s still incredibly low, but up sharply from 3.4 percent at the beginning of May.

If you doubt the power of the herd mentality to drive sales and prices in the real estate market, just recall what happened back during the nutty spring of 2010 as the expiration of the home buyer tax credit loomed.

Buyers bid up prices on homes in a scramble to grab the seemingly free government money before the offer expired, often negating the value of the $8,000 credit.

Could we see some panic buying over the summer if rates keep pushing up?

Don’t bet against it.

That said, in the longer term, higher rates could put a chill on sales, especially in high-priced markets like Greater Boston, or so says Lawrence Yun, chief economist for the National Association of Realtors.

OK, NAR is not exactly the first place I look for candid insight, but I thought Yun’s observations in this Forbes piece were worth looking at.

“In Middle America I don’t see much impact since homes are so affordable,” explains Yun. “The more expensive coastal regions is where one will begin to feel the first decline or impact.” He suspects that California metro areas and east coast hubs like Boston, New York, and Washington D.C. could begin to experience slackening sales because low-interest monthly mortgage payments in these relatively pricier places have helped make homes seem more affordable to more buyers despite the fact that relative to income, principal amounts are still expensive.

Are you ready to hit the panic button? Ready to buy now and ask questions later before rates go higher?


Categories
analytics general info

Vacation Hotspots

Fun post by Scott from Boston.com Real Estate

HomeImage-Aerial_Provincetown

Posted by Scott Van Voorhis

Ever wonder where your neighbors are headed on vacation? If you live in Greater Boston, it’s a good bet they aren’t headed very far.

Trulia today is releasing its list of the top vacation home destinations for each major metro market, as well as nationally, based on a tally of searches on the real estate portal.

Of the top ten most popular vacation home destinations for buyers from Greater Boston, nine are on Cape Cod.

In fact, the only break from the pattern is Wells, Maine. Sorry New Hampshire, Vermont and Rhode Island, you are out of luck.

Let’s not get big heads here, though. Sure, we love the Cape, though I’d argue traffic and overdevelopment is close to wrecking the place. Just get off Route 6 in Hyannis and take a scenic drive down Route 28.

But the rest of America is not so enamored with our favorite vacation playground.

Only one Massachusetts zip code managed to make it onto Trulia’s list of the top 20 vacation home destinations across the country.

And that happens to be Nantucket, which ranks at a distant No. 20 in popularity.

The most popular vacation home destination in America, at least according to Trulia, is not Chatham or Provincetown, but rather Cape May in New Jersey, and specifically, Oceanwood, where the median price is $525,000.

Here’s Trulia list:

Where Bostonians Search for Vacation Homes

# ZIP Code Town    State         Median Asking Price
1 02649 Mashpee  MA             $419,900
2 02639 Dennisport MA            $224,900
3 02540 Falmouth MA              $549,950
4 02554 Nantucket MA             $1,799,999
5 02536 Teaticket   MA             $379,000
6 02633 South Chatham MA     $815,000
7 02657 Provincetown MA         $596,500
8 02631 Brewster MA               $439,000
9 02642 Eastham MA               $445,750
10 04090 Wells ME                  $256,670